

SLV Pasang - Node Exporter
SLV Pasang - Node Exporter
Kenapa Node Exporter?
Node Exporter mengekspos perangkat keras dan metrik OS terrinci -CPU, memori, disk, jaringan - jadi Prometheus dan Grafana dapat waspada pada masalah infrastruktur sebelum mereka berdampak Solana loading. Instal melalui
slv install menjamin setiap server melaporkan set yang konsisten dari metrik sistem tanpa pengaturan manual.-
- Highlights * *
- Node Exporter: https://github.com/prometheus/node_exporter
- Biner ringan dengan biaya minimal, sempurna untuk logam atau host VPS.
- Menyediakan dasbor metrik dasar dan peringatan mengandalkan seluruh Prometheus/Grafana.
Jalankan Pemasang
Titik
slv install di host yang ingin anda monitor dan pilih Node Exporter dari daftar.bash
$ slv install -i 1.1.1.1,
🚀 Installing software components...
? Select Software Component to Install (Redis)
  Redis
  TiDB (MySQL Cluster)
  Grafana
  Prometheus
❯ Node Exporter
  Kafka Cluster
$ slv install -i 1.1.1.1,
🚀 Installing software components...
? Select Software Component to Install (Redis)
Redis
TiDB (MySQL Cluster)
Grafana
Prometheus
❯ Node Exporter
Kafka ClusterCatatan: Ganti1.1.1.1dengan IP alamat server Anda sendiri.
Tinjau Rincian
Gunakan layar rincian untuk mengkonfirmasi inventaris yang benar dan buku mainan sebelum Ansible dimulai.
bash
🚀 Installing software components...
? Select Software Component to Install (Redis) › Node Exporter
✅ You selected: Node Exporter

📋 Installation Details:
Software: Node Exporter
Inventory: 1.1.1.1,
Playbook: /Users/fumi/.slv/template/0.9.800/ansible/cmn/software/install-node-exporter.yml
? Do you want to proceed with the installation? (y/N) ›
🚀 Installing software components...
? Select Software Component to Install (Redis) › Node Exporter
✅ You selected: Node Exporter
📋 Installation Details:
Software: Node Exporter
Inventory: 1.1.1.1,
Playbook: /Users/fumi/.slv/template/0.9.800/ansible/cmn/software/install-node-exporter.yml
? Do you want to proceed with the installation? (y/N) ›Amati Ansible
slv menjalankan buku pedoman Node Exportir dan memungkinkannya sebagai layanan sistemd sehingga ia memulai otomatis dengan boot.bash
🚀 Running ansible: ansible-playbook -i 1.1.1.1, -u solv /Users/fumi/.slv/template/0.9.800/ansible/cmn/software/install-node-exporter.yml

PLAY [Install and configure Node Exporter] ***********************************************************

TASK [Gathering Facts] *******************************************************************************
🚀 Running ansible: ansible-playbook -i 1.1.1.1, -u solv /Users/fumi/.slv/template/0.9.800/ansible/cmn/software/install-node-exporter.yml
PLAY [Install and configure Node Exporter] ***********************************************************
TASK [Gathering Facts] *******************************************************************************Verifikasi Endpoint
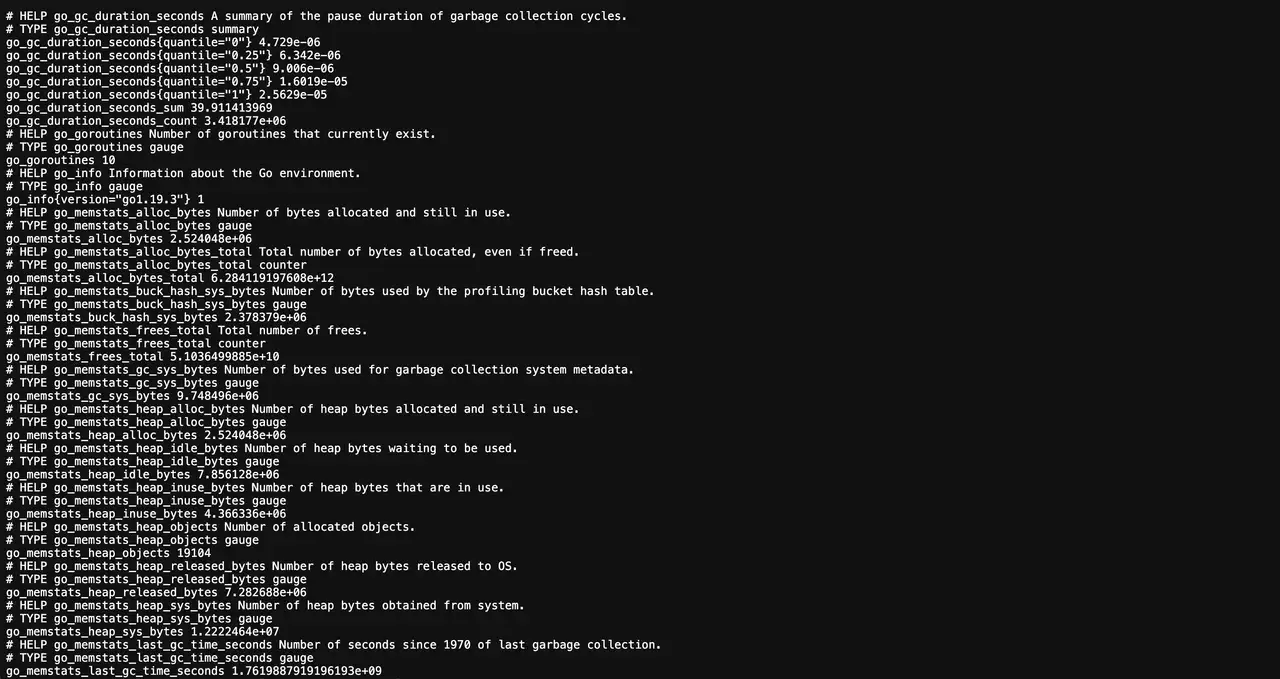
Setelah instalasi, Node Exporter menerbitkan metrik pada port 9100. Prometheus harus mengikis titik akhir ini untuk memberi makan dashboard dan peringatan.
bash
✅ Installation completed successfully!

🌐 Access Information:

Node Exporter URL: http://1.1.1.1:9100/metrics
✅ Installation completed successfully!
🌐 Access Information:
Node Exporter URL: http://1.1.1.1:9100/metricsDashboard
Kunjungi
http://1.1.1.1:9100/metrics untuk mengkonfirmasi keluaran mentah, kemudian menambahkan target dalam Prometheus dan plug telah di-predefined Grafana dashboard (mis., Node Exporter Full) untuk memvisualisasikan kesehatan host.