

SLV Install - Prometheus
SLV Install - Prometheus
Зачем Prometheus?
Prometheus — де-факто стандарт для time-series monitoring, который собирает metrics с помощью мощного языка запросов (PromQL) и опирается на богатую ecosystem exporters. Установка через
slv install дает вам единый metrics backbone, питающий dashboards Grafana и alert rules во всех средах.Основные моменты
- Prometheus: https://prometheus.io/
- Pull-based scraping делает трафик observability предсказуемым, а PromQL помогает получать применимые на практике выводы.
- Нативная интеграция с Grafana и Alertmanager позволяет визуализировать данные и отправлять уведомления без дополнительной настройки.
Запустите installer
Укажите host, на котором должен работать Prometheus, и выберите его в селекторе компонентов.
bash
$ slv install -i 1.1.1.1,
🚀 Installing software components...
? Select Software Component to Install (Redis)
  Redis
  TiDB (MySQL Cluster)
  Grafana
❯ Prometheus
  Node Exporter
  Kafka Cluster
$ slv install -i 1.1.1.1,
🚀 Installing software components...
? Select Software Component to Install (Redis)
Redis
TiDB (MySQL Cluster)
Grafana
❯ Prometheus
Node Exporter
Kafka ClusterПримечание: замените1.1.1.1на IP-адрес вашего сервера.
Проверьте детали
Перед запуском playbook подтвердите inventory, путь к playbook и, при необходимости, limit.
bash
🚀 Installing software components...
? Select Software Component to Install (Redis) › Prometheus
✅ You selected: Prometheus

📋 Installation Details:
Software: Prometheus
Inventory: 1.1.1.1,
Playbook: /Users/fumi/.slv/template/0.9.800/ansible/cmn/software/install-prometheus.yml
? Do you want to proceed with the installation? (y/N) ›
🚀 Installing software components...
? Select Software Component to Install (Redis) › Prometheus
✅ You selected: Prometheus
📋 Installation Details:
Software: Prometheus
Inventory: 1.1.1.1,
Playbook: /Users/fumi/.slv/template/0.9.800/ansible/cmn/software/install-prometheus.yml
? Do you want to proceed with the installation? (y/N) › Наблюдайте за выполнением Ansible
slv использует Ansible, чтобы установить Prometheus как systemd service и развернуть базовую конфигурацию.bash
🚀 Running ansible: ansible-playbook -i 1.1.1.1, -u solv /Users/fumi/.slv/template/0.9.800/ansible/cmn/software/install-prometheus.yml

PLAY [Install and configure Prometheus] **************************************************************

TASK [Gathering Facts] *******************************************************************************
🚀 Running ansible: ansible-playbook -i 1.1.1.1, -u solv /Users/fumi/.slv/template/0.9.800/ansible/cmn/software/install-prometheus.yml
PLAY [Install and configure Prometheus] **************************************************************
TASK [Gathering Facts] *******************************************************************************Проверьте endpoint
После завершения CLI выводит URL web UI Prometheus, чтобы вы могли убедиться, что targets корректно собираются.
bash
✅ Installation completed successfully!

🌐 Access Information:

Prometheus URL: http://1.1.1.1:3090
✅ Installation completed successfully!
🌐 Access Information:
Prometheus URL: http://1.1.1.1:3090Dashboard
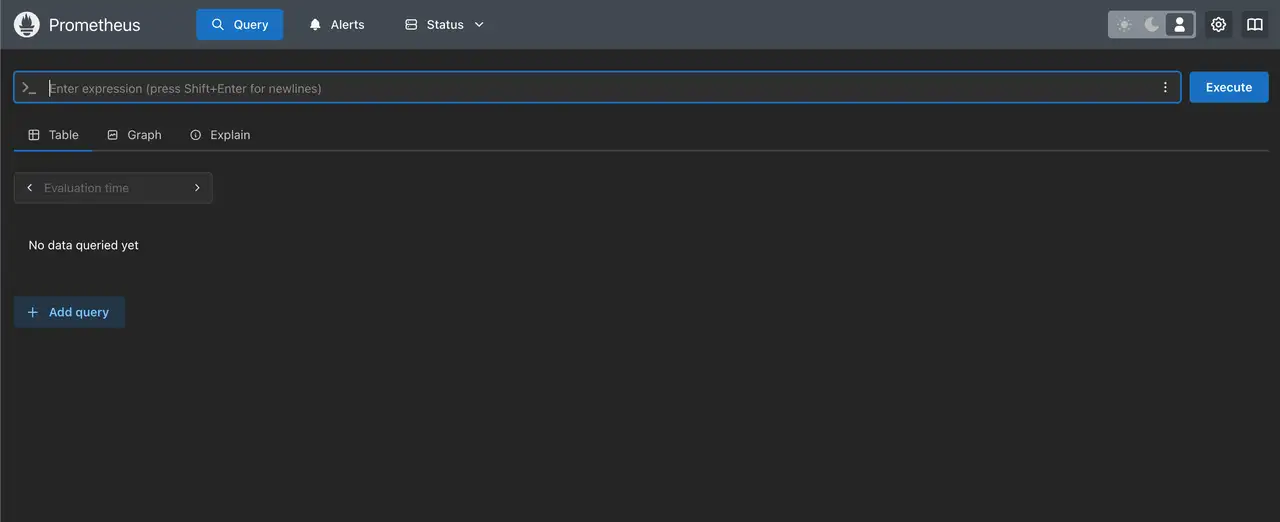
Откройте
http://1.1.1.1:3090, чтобы проверить страницу targets в Prometheus. Затем подключите Grafana для построения графиков на PromQL и настройте alert rules через Alertmanager.