

SLV Install - Node Exporter
SLV Install - Node Exporter
Tại sao nên dùng Node Exporter?
Node Exporter xuất các metric chi tiết về phần cứng và hệ điều hành — CPU, bộ nhớ, ổ đĩa, mạng — để Prometheus và Grafana có thể cảnh báo về các vấn đề hạ tầng trước khi chúng ảnh hưởng đến các workload Solana. Cài đặt qua
slv install đảm bảo mọi máy chủ báo cáo một bộ metric hệ thống nhất quán mà không cần thiết lập thủ công.Điểm nổi bật
- Node Exporter: https://github.com/prometheus/node_exporter
- Binary nhẹ với overhead tối thiểu, hoàn hảo cho host bare metal hoặc VPS.
- Cung cấp các metric nền tảng mà dashboard và cảnh báo dựa vào trên Prometheus/Grafana.
Chạy trình cài đặt
Trỏ
slv install đến host bạn muốn giám sát và chọn Node Exporter từ danh sách.bash
$ slv install -i 1.1.1.1,
🚀 Installing software components...
? Select Software Component to Install (Redis)
  Redis
  TiDB (MySQL Cluster)
  Grafana
  Prometheus
❯ Node Exporter
  Kafka Cluster
$ slv install -i 1.1.1.1,
🚀 Installing software components...
? Select Software Component to Install (Redis)
Redis
TiDB (MySQL Cluster)
Grafana
Prometheus
❯ Node Exporter
Kafka ClusterLưu ý: Thay1.1.1.1bằng địa chỉ IP máy chủ của bạn.
Xem lại chi tiết
Sử dụng màn hình chi tiết để xác nhận inventory và playbook chính xác trước khi Ansible bắt đầu.
bash
🚀 Installing software components...
? Select Software Component to Install (Redis) › Node Exporter
✅ You selected: Node Exporter

📋 Installation Details:
Software: Node Exporter
Inventory: 1.1.1.1,
Playbook: /Users/fumi/.slv/template/0.9.800/ansible/cmn/software/install-node-exporter.yml
? Do you want to proceed with the installation? (y/N) ›
🚀 Installing software components...
? Select Software Component to Install (Redis) › Node Exporter
✅ You selected: Node Exporter
📋 Installation Details:
Software: Node Exporter
Inventory: 1.1.1.1,
Playbook: /Users/fumi/.slv/template/0.9.800/ansible/cmn/software/install-node-exporter.yml
? Do you want to proceed with the installation? (y/N) ›Theo dõi quá trình thực thi Ansible
slv chạy playbook Node Exporter và kích hoạt nó dưới dạng dịch vụ systemd để tự động khởi động cùng hệ thống.bash
🚀 Running ansible: ansible-playbook -i 1.1.1.1, -u solv /Users/fumi/.slv/template/0.9.800/ansible/cmn/software/install-node-exporter.yml

PLAY [Install and configure Node Exporter] ***********************************************************

TASK [Gathering Facts] *******************************************************************************
🚀 Running ansible: ansible-playbook -i 1.1.1.1, -u solv /Users/fumi/.slv/template/0.9.800/ansible/cmn/software/install-node-exporter.yml
PLAY [Install and configure Node Exporter] ***********************************************************
TASK [Gathering Facts] *******************************************************************************Xác minh endpoint
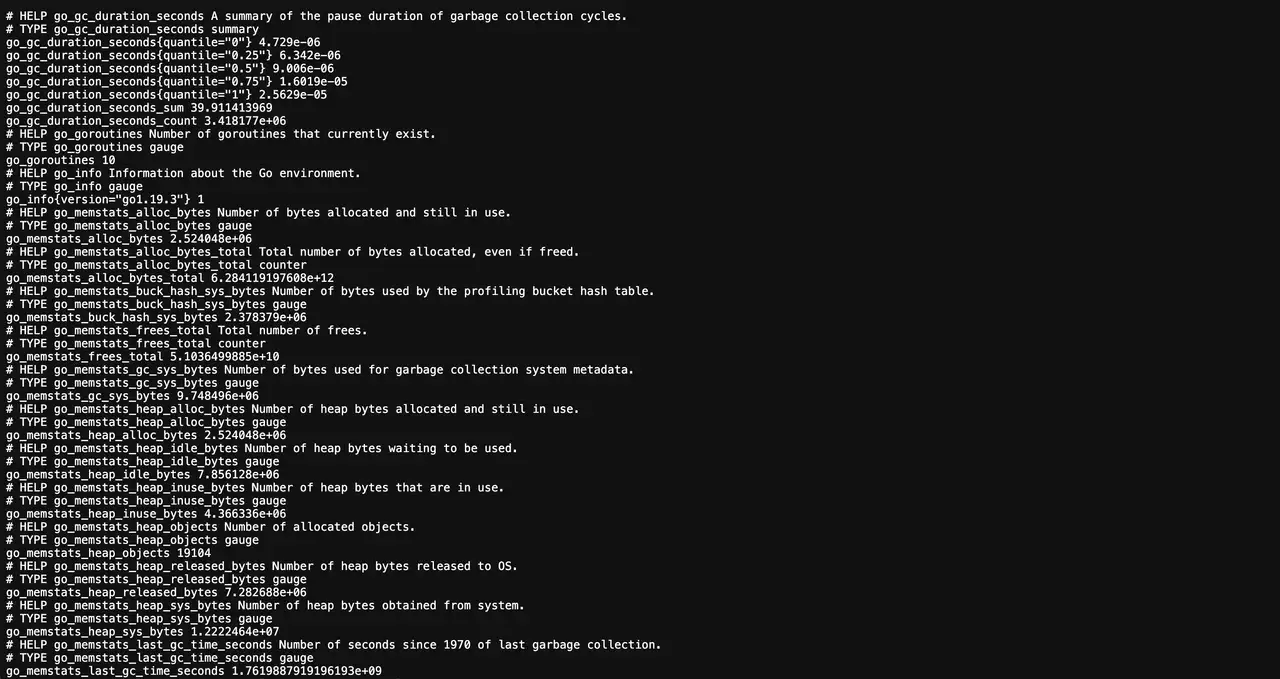
Sau khi cài đặt, Node Exporter xuất metric trên cổng 9100. Prometheus nên scrape endpoint này để cung cấp dữ liệu cho dashboard và cảnh báo.
bash
✅ Installation completed successfully!

🌐 Access Information:

Node Exporter URL: http://1.1.1.1:9100/metrics
✅ Installation completed successfully!
🌐 Access Information:
Node Exporter URL: http://1.1.1.1:9100/metricsDashboard
Truy cập
http://1.1.1.1:9100/metrics để xác nhận output thô, sau đó thêm target trong Prometheus và kết nối các Grafana dashboard có sẵn (ví dụ: Node Exporter Full) để trực quan hóa tình trạng host.