

SLV Install - Prometheus
SLV Install - Prometheus
Tại sao nên dùng Prometheus?
Prometheus là tiêu chuẩn thực tế cho giám sát chuỗi thời gian, thu thập metric với ngôn ngữ truy vấn mạnh mẽ (PromQL) và hệ sinh thái exporter phong phú. Cài đặt qua
slv install mang đến cho bạn nền tảng metric nhất quán, cung cấp dữ liệu cho Grafana dashboard và quy tắc cảnh báo trên mọi môi trường.Điểm nổi bật
- Prometheus: https://prometheus.io/
- Cơ chế pull-based scraping giữ lưu lượng giám sát ổn định trong khi PromQL cung cấp thông tin hành động.
- Tích hợp gốc với Grafana và Alertmanager để bạn có thể trực quan hóa và thông báo mà không cần thiết lập thêm.
Chạy trình cài đặt
Trỏ đến host sẽ chạy Prometheus và chọn nó từ bộ chọn thành phần.
bash
$ slv install -i 1.1.1.1,
🚀 Installing software components...
? Select Software Component to Install (Redis)
  Redis
  TiDB (MySQL Cluster)
  Grafana
❯ Prometheus
  Node Exporter
  Kafka Cluster
$ slv install -i 1.1.1.1,
🚀 Installing software components...
? Select Software Component to Install (Redis)
Redis
TiDB (MySQL Cluster)
Grafana
❯ Prometheus
Node Exporter
Kafka ClusterLưu ý: Thay1.1.1.1bằng địa chỉ IP máy chủ của bạn.
Xem lại chi tiết
Xác nhận inventory, đường dẫn playbook và giới hạn tùy chọn trước khi playbook bắt đầu.
bash
🚀 Installing software components...
? Select Software Component to Install (Redis) › Prometheus
✅ You selected: Prometheus

📋 Installation Details:
Software: Prometheus
Inventory: 1.1.1.1,
Playbook: /Users/fumi/.slv/template/0.9.800/ansible/cmn/software/install-prometheus.yml
? Do you want to proceed with the installation? (y/N) ›
🚀 Installing software components...
? Select Software Component to Install (Redis) › Prometheus
✅ You selected: Prometheus
📋 Installation Details:
Software: Prometheus
Inventory: 1.1.1.1,
Playbook: /Users/fumi/.slv/template/0.9.800/ansible/cmn/software/install-prometheus.yml
? Do you want to proceed with the installation? (y/N) ›Theo dõi quá trình thực thi Ansible
slv sử dụng Ansible để cài đặt Prometheus dưới dạng dịch vụ systemd và áp dụng cấu hình cơ bản.bash
🚀 Running ansible: ansible-playbook -i 1.1.1.1, -u solv /Users/fumi/.slv/template/0.9.800/ansible/cmn/software/install-prometheus.yml

PLAY [Install and configure Prometheus] **************************************************************

TASK [Gathering Facts] *******************************************************************************
🚀 Running ansible: ansible-playbook -i 1.1.1.1, -u solv /Users/fumi/.slv/template/0.9.800/ansible/cmn/software/install-prometheus.yml
PLAY [Install and configure Prometheus] **************************************************************
TASK [Gathering Facts] *******************************************************************************Xác minh endpoint
Sau khi hoàn tất, CLI in ra URL giao diện web Prometheus để bạn có thể xác nhận các target đang được scrape đúng cách.
bash
✅ Installation completed successfully!

🌐 Access Information:

Prometheus URL: http://1.1.1.1:3090
✅ Installation completed successfully!
🌐 Access Information:
Prometheus URL: http://1.1.1.1:3090Dashboard
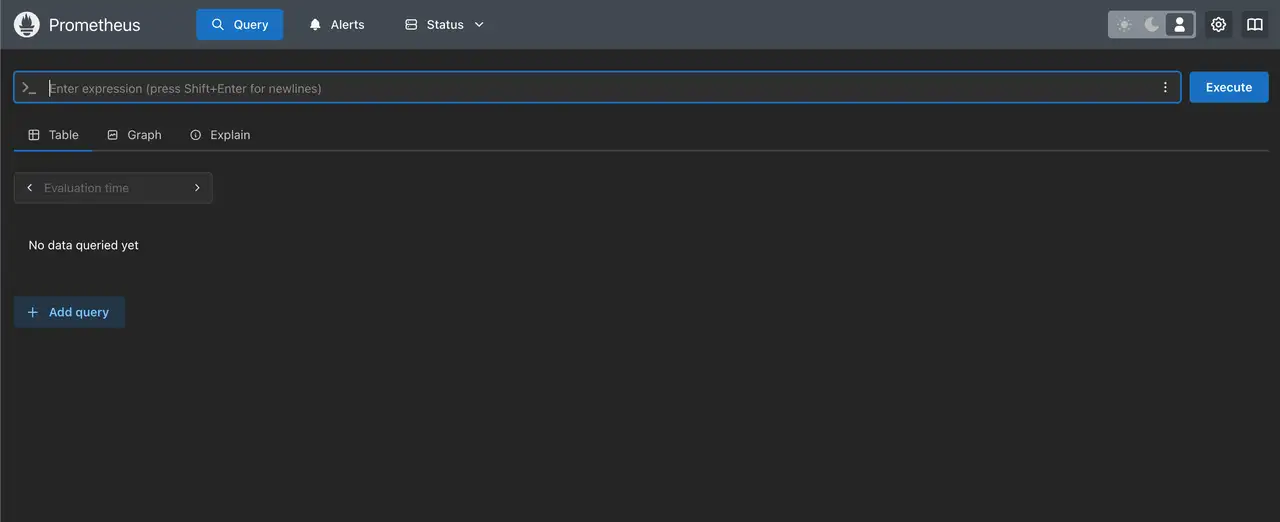
Mở
http://1.1.1.1:3090 để xác minh trang target của Prometheus. Kết hợp với Grafana để vẽ đồ thị metric bằng PromQL và thiết lập quy tắc cảnh báo thông qua Alertmanager.