

SLV Install - Grafana
SLV Install - Grafana
为什么选择 Grafana?
Grafana 将指标、日志和链路追踪集中到丰富的仪表板中,使运维人员能够一目了然地了解基础设施健康状况。使用
slv install 部署可以为每个环境提供相同的可观测性堆栈,无需手动配置。亮点
- Grafana:https://grafana.com/
- 构建可复用的仪表板和告警,即时发现验证者或 RPC 性能问题。
- 开箱即用地连接 Prometheus、Loki、MySQL 和数十种其他数据源。
运行安装程序
将
slv install 指向要部署 Grafana 的主机,并从组件列表中选择它。bash
$ slv install -i 1.1.1.1,
🚀 Installing software components...
? Select Software Component to Install (Redis)
  Redis
  TiDB (MySQL Cluster)
❯ Grafana
  Prometheus
  Node Exporter
  Kafka Cluster
$ slv install -i 1.1.1.1,
🚀 Installing software components...
? Select Software Component to Install (Redis)
Redis
TiDB (MySQL Cluster)
❯ Grafana
Prometheus
Node Exporter
Kafka Cluster注意:请将1.1.1.1替换为您自己服务器的 IP 地址。
查看详细信息
在启动 Ansible 之前,验证清单和 Playbook 路径。如果目标主机或配置看起来不正确,请在此取消。
bash
🚀 Installing software components...
? Select Software Component to Install (Redis) › Grafana
✅ You selected: Grafana

📋 Installation Details:
Software: Grafana
Inventory: 1.1.1.1,
Playbook: /Users/fumi/.slv/template/0.9.800/ansible/cmn/software/install-grafana.yml
? Do you want to proceed with the installation? (y/N) ›
🚀 Installing software components...
? Select Software Component to Install (Redis) › Grafana
✅ You selected: Grafana
📋 Installation Details:
Software: Grafana
Inventory: 1.1.1.1,
Playbook: /Users/fumi/.slv/template/0.9.800/ansible/cmn/software/install-grafana.yml
? Do you want to proceed with the installation? (y/N) ›观察 Ansible 执行
确认后,
slv 运行 Grafana Playbook 并将服务配置为原生 Linux 守护进程。bash
🚀 Running ansible: ansible-playbook -i 1.1.1.1, -u solv /Users/fumi/.slv/template/0.9.800/ansible/cmn/software/install-grafana.yml

PLAY [Install and configure Grafana] ****************************************************************

TASK [Gathering Facts] *******************************************************************************
🚀 Running ansible: ansible-playbook -i 1.1.1.1, -u solv /Users/fumi/.slv/template/0.9.800/ansible/cmn/software/install-grafana.yml
PLAY [Install and configure Grafana] ****************************************************************
TASK [Gathering Facts] *******************************************************************************验证端点
安装成功后,会显示 Grafana 登录 URL 和默认凭据,以便您可以立即登录。
bash
✅ Installation completed successfully!

🌐 Access Information:

Grafana URL: http://1.1.1.1:3000/login

🔑 Default credentials
Username: admin
Password: admin
✅ Installation completed successfully!
🌐 Access Information:
Grafana URL: http://1.1.1.1:3000/login
🔑 Default credentials
Username: admin
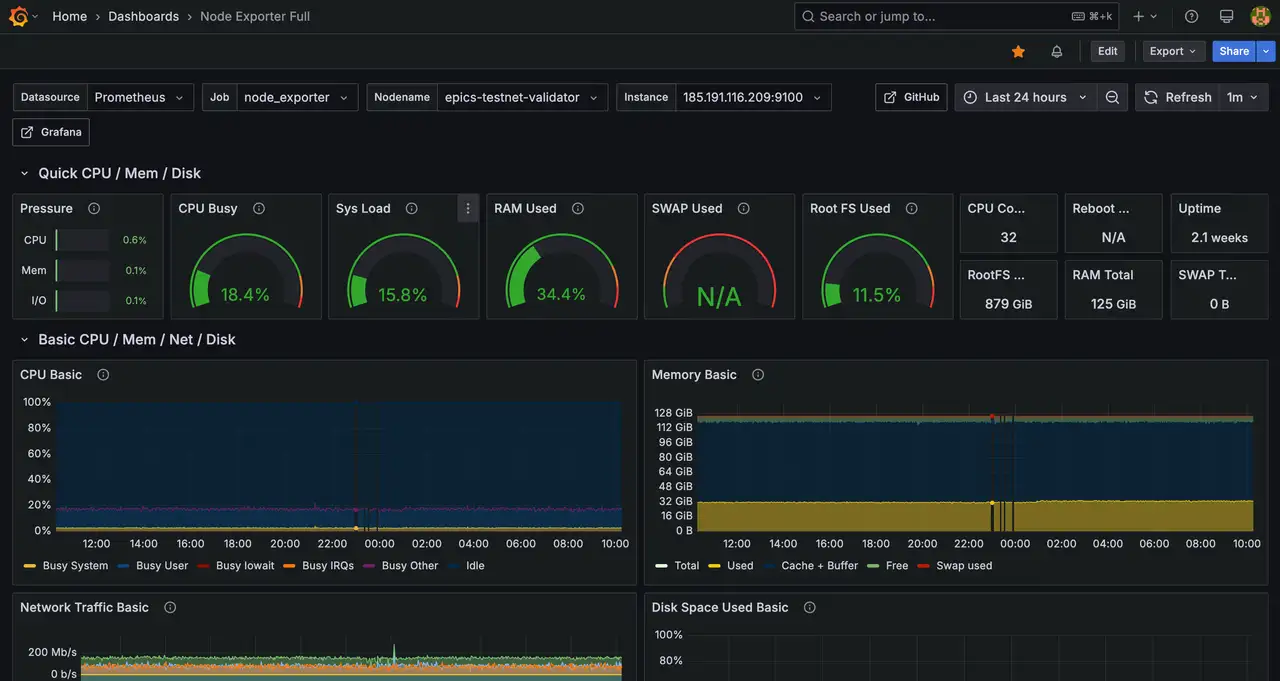
Password: admin仪表板
在
http://1.1.1.1:3000/login 登录并导入您的仪表板或将 Prometheus 连接为数据源。建议在配置完成后截取主仪表板的截图,用于内部运行手册。