

SLV Install - Node Exporter
SLV Install - Node Exporter
为什么选择 Node Exporter?
Node Exporter 暴露详细的硬件和操作系统指标——CPU、内存、磁盘、网络——以便 Prometheus 和 Grafana 可以在基础设施问题影响 Solana 工作负载之前发出告警。通过
slv install 安装可确保每台服务器报告一致的系统指标集,无需手动设置。亮点
- Node Exporter:https://github.com/prometheus/node_exporter
- 轻量级二进制文件,开销极小,非常适合裸金属服务器或 VPS 主机。
- 提供 Prometheus/Grafana 仪表板和告警所依赖的基线指标。
运行安装程序
将
slv install 指向要监控的主机,并从列表中选择 Node Exporter。bash
$ slv install -i 1.1.1.1,
🚀 Installing software components...
? Select Software Component to Install (Redis)
  Redis
  TiDB (MySQL Cluster)
  Grafana
  Prometheus
❯ Node Exporter
  Kafka Cluster
$ slv install -i 1.1.1.1,
🚀 Installing software components...
? Select Software Component to Install (Redis)
Redis
TiDB (MySQL Cluster)
Grafana
Prometheus
❯ Node Exporter
Kafka Cluster注意:请将1.1.1.1替换为您自己服务器的 IP 地址。
查看详细信息
使用详细信息界面确认正确的清单和 Playbook,然后再开始 Ansible。
bash
🚀 Installing software components...
? Select Software Component to Install (Redis) › Node Exporter
✅ You selected: Node Exporter

📋 Installation Details:
Software: Node Exporter
Inventory: 1.1.1.1,
Playbook: /Users/fumi/.slv/template/0.9.800/ansible/cmn/software/install-node-exporter.yml
? Do you want to proceed with the installation? (y/N) ›
🚀 Installing software components...
? Select Software Component to Install (Redis) › Node Exporter
✅ You selected: Node Exporter
📋 Installation Details:
Software: Node Exporter
Inventory: 1.1.1.1,
Playbook: /Users/fumi/.slv/template/0.9.800/ansible/cmn/software/install-node-exporter.yml
? Do you want to proceed with the installation? (y/N) ›观察 Ansible 执行
slv 运行 Node Exporter Playbook 并将其启用为 systemd 服务,以便在启动时自动运行。bash
🚀 Running ansible: ansible-playbook -i 1.1.1.1, -u solv /Users/fumi/.slv/template/0.9.800/ansible/cmn/software/install-node-exporter.yml

PLAY [Install and configure Node Exporter] ***********************************************************

TASK [Gathering Facts] *******************************************************************************
🚀 Running ansible: ansible-playbook -i 1.1.1.1, -u solv /Users/fumi/.slv/template/0.9.800/ansible/cmn/software/install-node-exporter.yml
PLAY [Install and configure Node Exporter] ***********************************************************
TASK [Gathering Facts] *******************************************************************************验证端点
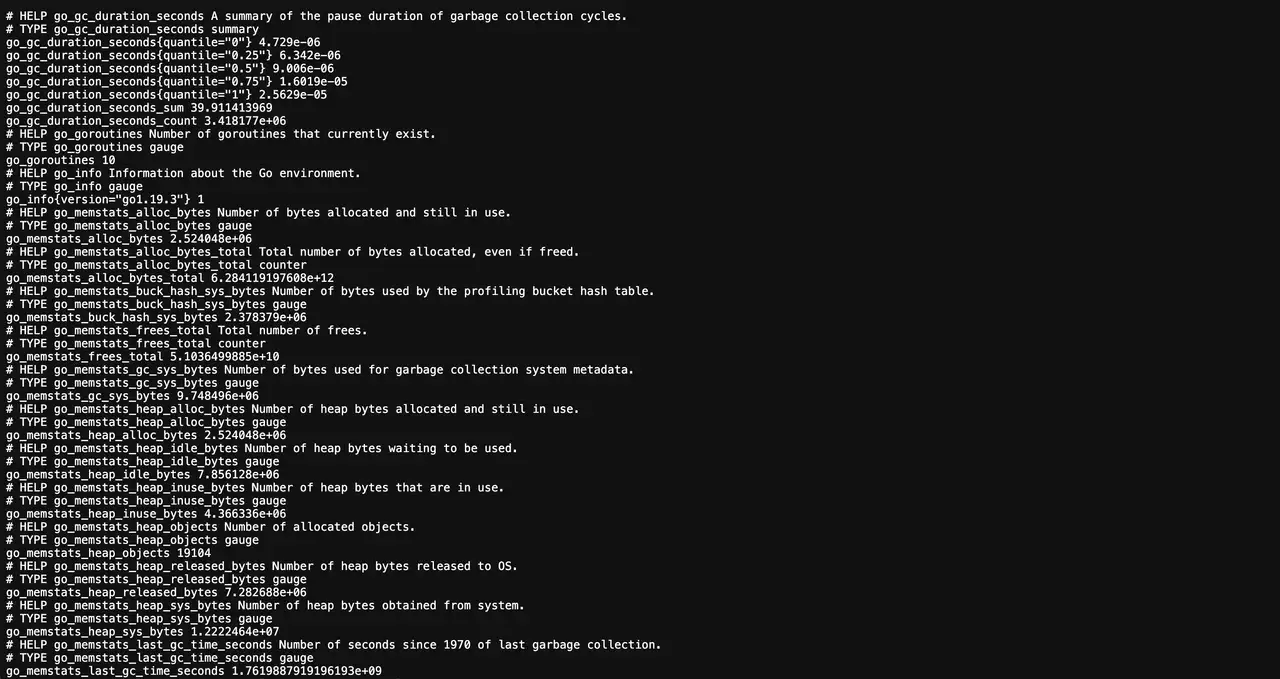
安装完成后,Node Exporter 在端口 9100 上发布指标。Prometheus 应该抓取此端点以供仪表板和告警使用。
bash
✅ Installation completed successfully!

🌐 Access Information:

Node Exporter URL: http://1.1.1.1:9100/metrics
✅ Installation completed successfully!
🌐 Access Information:
Node Exporter URL: http://1.1.1.1:9100/metrics仪表板
访问
http://1.1.1.1:9100/metrics 确认原始输出,然后在 Prometheus 中添加目标并使用预定义的 Grafana 仪表板(例如 Node Exporter Full)来可视化主机健康状况。