

SLV Install - Grafana
SLV Install - Grafana
Why Grafana?
Grafana centralizes metrics, logs, and traces into rich dashboards so operators can understand infrastructure health at a glance. Deploying it with
slv install gives every environment the same observability stack without manual provisioning.Highlights
- Grafana: https://grafana.com/
- Build reusable dashboards and alerts that surface validator or RPC performance issues instantly.
- Connects to Prometheus, Loki, MySQL, and dozens of other data sources out of the box.
Run the Installer
Point
slv install at the host destined to serve Grafana and select it from the component list.bash
$ slv install -i 1.1.1.1,
🚀 Installing software components...
? Select Software Component to Install (Redis)
  Redis
  TiDB (MySQL Cluster)
❯ Grafana
  Prometheus
  Node Exporter
  Kafka Cluster
$ slv install -i 1.1.1.1,
🚀 Installing software components...
? Select Software Component to Install (Redis)
Redis
TiDB (MySQL Cluster)
❯ Grafana
Prometheus
Node Exporter
Kafka ClusterNote: Replace1.1.1.1with the IP address of your own server.
Review the Details
Validate the inventory and playbook path before launching Ansible. Cancel here if the target host or configuration looks incorrect.
bash
🚀 Installing software components...
? Select Software Component to Install (Redis) › Grafana
✅ You selected: Grafana

📋 Installation Details:
Software: Grafana
Inventory: 1.1.1.1,
Playbook: /Users/fumi/.slv/template/0.9.800/ansible/cmn/software/install-grafana.yml
? Do you want to proceed with the installation? (y/N) ›
🚀 Installing software components...
? Select Software Component to Install (Redis) › Grafana
✅ You selected: Grafana
📋 Installation Details:
Software: Grafana
Inventory: 1.1.1.1,
Playbook: /Users/fumi/.slv/template/0.9.800/ansible/cmn/software/install-grafana.yml
? Do you want to proceed with the installation? (y/N) › Observe Ansible Execution
Upon confirmation,
slv runs the Grafana playbook and configures the service as a native Linux daemon.bash
🚀 Running ansible: ansible-playbook -i 1.1.1.1, -u solv /Users/fumi/.slv/template/0.9.800/ansible/cmn/software/install-grafana.yml

PLAY [Install and configure Grafana] ****************************************************************

TASK [Gathering Facts] *******************************************************************************
🚀 Running ansible: ansible-playbook -i 1.1.1.1, -u solv /Users/fumi/.slv/template/0.9.800/ansible/cmn/software/install-grafana.yml
PLAY [Install and configure Grafana] ****************************************************************
TASK [Gathering Facts] *******************************************************************************Verify the Endpoint
Successful installs finish with the Grafana login URL and default credentials so you can sign in immediately.
bash
✅ Installation completed successfully!

🌐 Access Information:

Grafana URL: http://1.1.1.1:3000/login

🔑 Default credentials
Username: admin
Password: admin
✅ Installation completed successfully!
🌐 Access Information:
Grafana URL: http://1.1.1.1:3000/login
🔑 Default credentials
Username: admin
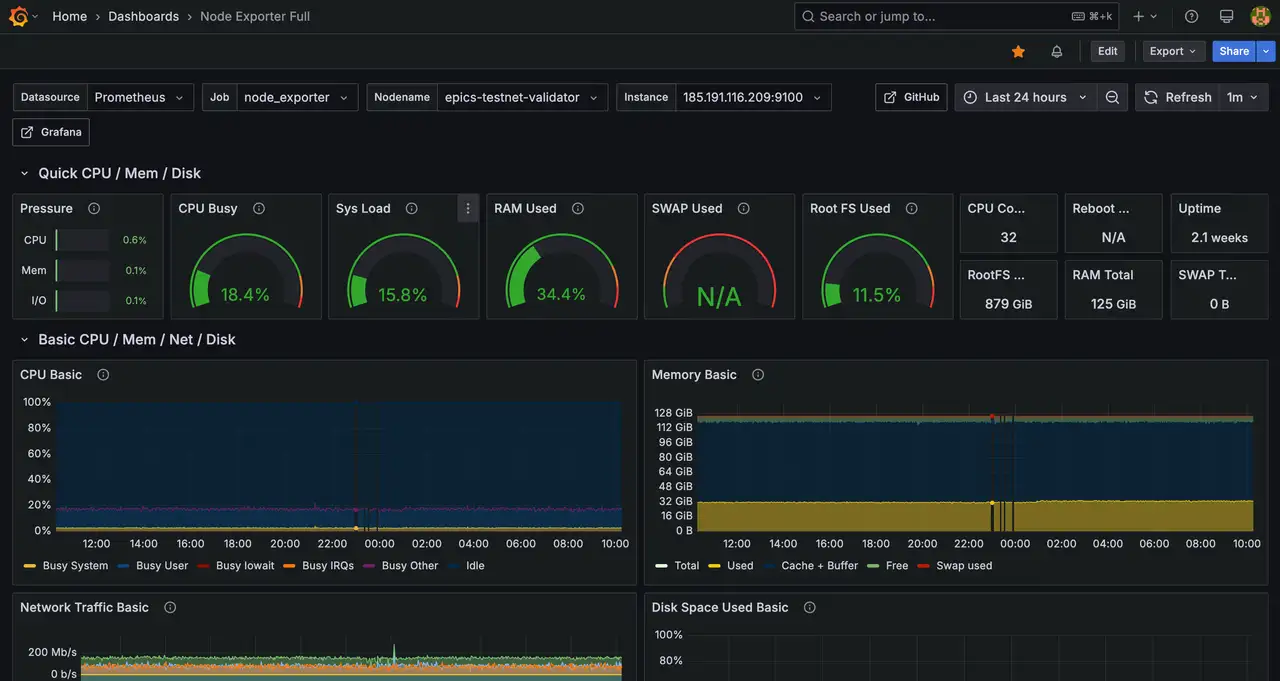
Password: adminDashboard
Log in at
http://1.1.1.1:3000/login and import your dashboards or connect Prometheus as a data source. Consider capturing a screenshot of your primary dashboard once configured for internal runbooks.