

SLV Install - Node Exporter
SLV Install - Node Exporter
Why Node Exporter?
Node Exporter exposes detailed hardware and OS metrics—CPU, memory, disk, network—so Prometheus and Grafana can alert on infrastructure issues before they impact Solana workloads. Installing it via
slv install ensures every server reports a consistent set of system metrics without manual setup.Highlights
- Node Exporter: https://github.com/prometheus/node_exporter
- Lightweight binary with minimal overhead, perfect for bare metal or VPS hosts.
- Provides the baseline metrics dashboards and alerts rely on across Prometheus/Grafana.
Run the Installer
Point
slv install at the host you want to monitor and select Node Exporter from the list.bash
$ slv install -i 1.1.1.1,
🚀 Installing software components...
? Select Software Component to Install (Redis)
  Redis
  TiDB (MySQL Cluster)
  Grafana
  Prometheus
❯ Node Exporter
  Kafka Cluster
$ slv install -i 1.1.1.1,
🚀 Installing software components...
? Select Software Component to Install (Redis)
Redis
TiDB (MySQL Cluster)
Grafana
Prometheus
❯ Node Exporter
Kafka ClusterNote: Replace1.1.1.1with the IP address of your own server.
Review the Details
Use the details screen to confirm the correct inventory and playbook before Ansible begins.
bash
🚀 Installing software components...
? Select Software Component to Install (Redis) › Node Exporter
✅ You selected: Node Exporter

📋 Installation Details:
Software: Node Exporter
Inventory: 1.1.1.1,
Playbook: /Users/fumi/.slv/template/0.9.800/ansible/cmn/software/install-node-exporter.yml
? Do you want to proceed with the installation? (y/N) ›
🚀 Installing software components...
? Select Software Component to Install (Redis) › Node Exporter
✅ You selected: Node Exporter
📋 Installation Details:
Software: Node Exporter
Inventory: 1.1.1.1,
Playbook: /Users/fumi/.slv/template/0.9.800/ansible/cmn/software/install-node-exporter.yml
? Do you want to proceed with the installation? (y/N) › Observe Ansible Execution
slv runs the Node Exporter playbook and enables it as a systemd service so it starts automatically on boot.bash
🚀 Running ansible: ansible-playbook -i 1.1.1.1, -u solv /Users/fumi/.slv/template/0.9.800/ansible/cmn/software/install-node-exporter.yml

PLAY [Install and configure Node Exporter] ***********************************************************

TASK [Gathering Facts] *******************************************************************************
🚀 Running ansible: ansible-playbook -i 1.1.1.1, -u solv /Users/fumi/.slv/template/0.9.800/ansible/cmn/software/install-node-exporter.yml
PLAY [Install and configure Node Exporter] ***********************************************************
TASK [Gathering Facts] *******************************************************************************Verify the Endpoint
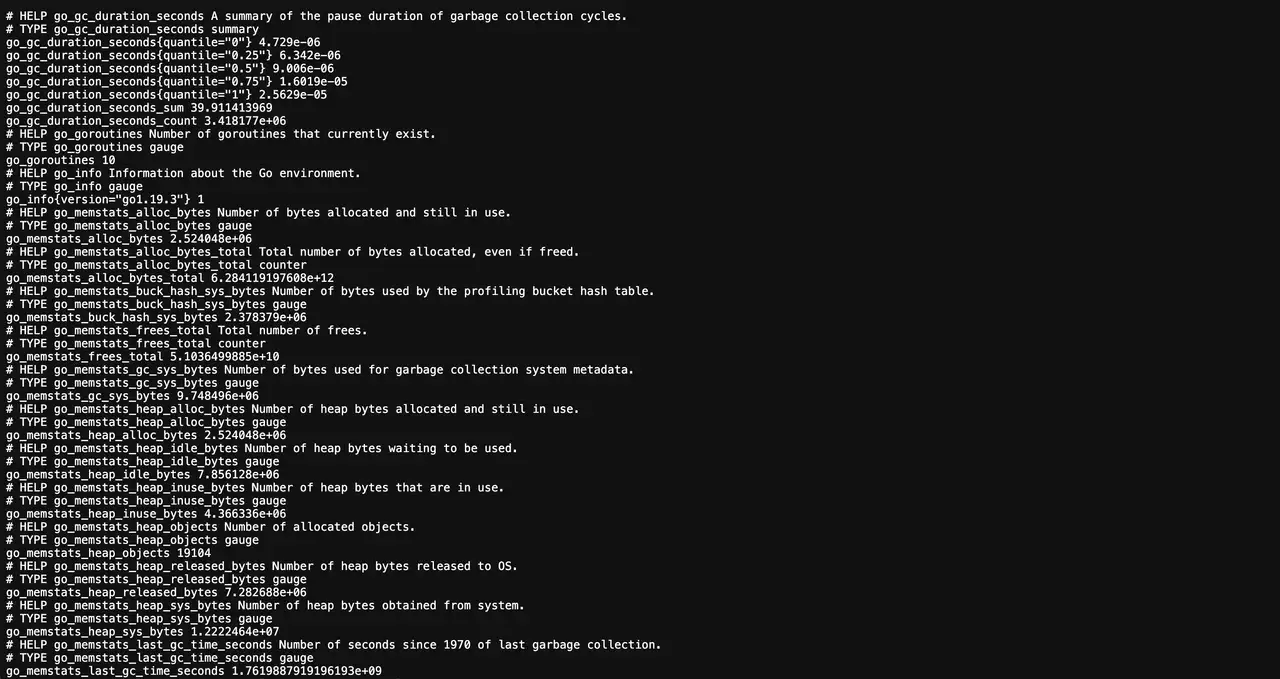
After installation, Node Exporter publishes metrics on port 9100. Prometheus should scrape this endpoint to feed dashboards and alerts.
bash
✅ Installation completed successfully!

🌐 Access Information:

Node Exporter URL: http://1.1.1.1:9100/metrics
✅ Installation completed successfully!
🌐 Access Information:
Node Exporter URL: http://1.1.1.1:9100/metricsDashboard
Visit
http://1.1.1.1:9100/metrics to confirm raw output, then add the target in Prometheus and plug predefined Grafana dashboards (e.g., Node Exporter Full) to visualize host health.