

SLV Install - Prometheus
SLV Install - Prometheus
Why Prometheus?
Prometheus is the de facto standard for time-series monitoring, collecting metrics with a powerful query language (PromQL) and a rich ecosystem of exporters. Installing it via
slv install gives you a consistent metrics backbone that feeds Grafana dashboards and alerting rules across every environment.Highlights
- Prometheus: https://prometheus.io/
- Pull-based scraping keeps observability traffic predictable while PromQL surfaces actionable insights.
- Native integration with Grafana and Alertmanager so you can visualize and notify without extra setup.
Run the Installer
Target the host that should run Prometheus and choose it from the component selector.
bash
$ slv install -i 1.1.1.1,
🚀 Installing software components...
? Select Software Component to Install (Redis)
  Redis
  TiDB (MySQL Cluster)
  Grafana
❯ Prometheus
  Node Exporter
  Kafka Cluster
$ slv install -i 1.1.1.1,
🚀 Installing software components...
? Select Software Component to Install (Redis)
Redis
TiDB (MySQL Cluster)
Grafana
❯ Prometheus
Node Exporter
Kafka ClusterNote: Replace1.1.1.1with the IP address of your own server.
Review the Details
Confirm the inventory, playbook path, and optional limit before the playbook kicks off.
bash
🚀 Installing software components...
? Select Software Component to Install (Redis) › Prometheus
✅ You selected: Prometheus

📋 Installation Details:
Software: Prometheus
Inventory: 1.1.1.1,
Playbook: /Users/fumi/.slv/template/0.9.800/ansible/cmn/software/install-prometheus.yml
? Do you want to proceed with the installation? (y/N) ›
🚀 Installing software components...
? Select Software Component to Install (Redis) › Prometheus
✅ You selected: Prometheus
📋 Installation Details:
Software: Prometheus
Inventory: 1.1.1.1,
Playbook: /Users/fumi/.slv/template/0.9.800/ansible/cmn/software/install-prometheus.yml
? Do you want to proceed with the installation? (y/N) › Observe Ansible Execution
slv leverages Ansible to install Prometheus as a systemd service and drop in the baseline configuration.bash
🚀 Running ansible: ansible-playbook -i 1.1.1.1, -u solv /Users/fumi/.slv/template/0.9.800/ansible/cmn/software/install-prometheus.yml

PLAY [Install and configure Prometheus] **************************************************************

TASK [Gathering Facts] *******************************************************************************
🚀 Running ansible: ansible-playbook -i 1.1.1.1, -u solv /Users/fumi/.slv/template/0.9.800/ansible/cmn/software/install-prometheus.yml
PLAY [Install and configure Prometheus] **************************************************************
TASK [Gathering Facts] *******************************************************************************Verify the Endpoint
Once finished, the CLI prints the Prometheus web UI URL so you can confirm targets are scraping correctly.
bash
✅ Installation completed successfully!

🌐 Access Information:

Prometheus URL: http://1.1.1.1:3090
✅ Installation completed successfully!
🌐 Access Information:
Prometheus URL: http://1.1.1.1:3090Dashboard
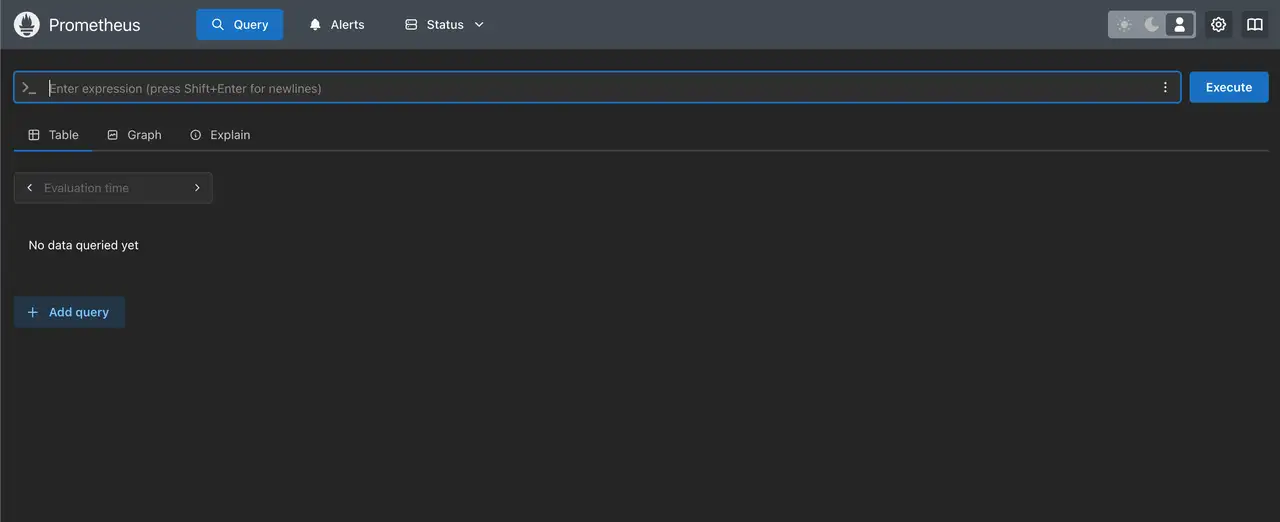
Open
http://1.1.1.1:3090 to verify the Prometheus targets page. Pair it with Grafana to graph metrics using PromQL and set up alert rules through Alertmanager.