

SLV Install - Node Exporter
SLV Install - Node Exporter
為什麼選擇 Node Exporter?
Node Exporter 暴露詳細的硬體和作業系統指標——CPU、記憶體、磁碟、網路——以便 Prometheus 和 Grafana 可以在基礎設施問題影響 Solana 工作負載之前發出告警。透過
slv install 安裝可確保每臺伺服器報告一致的系統指標集,無需手動設定。亮點
- Node Exporter:https://github.com/prometheus/node_exporter
- 輕量級二進位制檔案,開銷極小,非常適合裸金屬伺服器或 VPS 主機。
- 提供 Prometheus/Grafana 儀表板和告警所依賴的基線指標。
執行安裝程式
將
slv install 指向要監控的主機,並從列表中選擇 Node Exporter。bash
$ slv install -i 1.1.1.1,
🚀 Installing software components...
? Select Software Component to Install (Redis)
  Redis
  TiDB (MySQL Cluster)
  Grafana
  Prometheus
❯ Node Exporter
  Kafka Cluster
$ slv install -i 1.1.1.1,
🚀 Installing software components...
? Select Software Component to Install (Redis)
Redis
TiDB (MySQL Cluster)
Grafana
Prometheus
❯ Node Exporter
Kafka Cluster注意:請將1.1.1.1替換為您自己伺服器的 IP 地址。
檢視詳細資訊
使用詳細資訊介面確認正確的清單和 Playbook,然後再開始 Ansible。
bash
🚀 Installing software components...
? Select Software Component to Install (Redis) › Node Exporter
✅ You selected: Node Exporter

📋 Installation Details:
Software: Node Exporter
Inventory: 1.1.1.1,
Playbook: /Users/fumi/.slv/template/0.9.800/ansible/cmn/software/install-node-exporter.yml
? Do you want to proceed with the installation? (y/N) ›
🚀 Installing software components...
? Select Software Component to Install (Redis) › Node Exporter
✅ You selected: Node Exporter
📋 Installation Details:
Software: Node Exporter
Inventory: 1.1.1.1,
Playbook: /Users/fumi/.slv/template/0.9.800/ansible/cmn/software/install-node-exporter.yml
? Do you want to proceed with the installation? (y/N) ›觀察 Ansible 執行
slv 執行 Node Exporter Playbook 並將其啟用為 systemd 服務,以便在啟動時自動執行。bash
🚀 Running ansible: ansible-playbook -i 1.1.1.1, -u solv /Users/fumi/.slv/template/0.9.800/ansible/cmn/software/install-node-exporter.yml

PLAY [Install and configure Node Exporter] ***********************************************************

TASK [Gathering Facts] *******************************************************************************
🚀 Running ansible: ansible-playbook -i 1.1.1.1, -u solv /Users/fumi/.slv/template/0.9.800/ansible/cmn/software/install-node-exporter.yml
PLAY [Install and configure Node Exporter] ***********************************************************
TASK [Gathering Facts] *******************************************************************************驗證端點
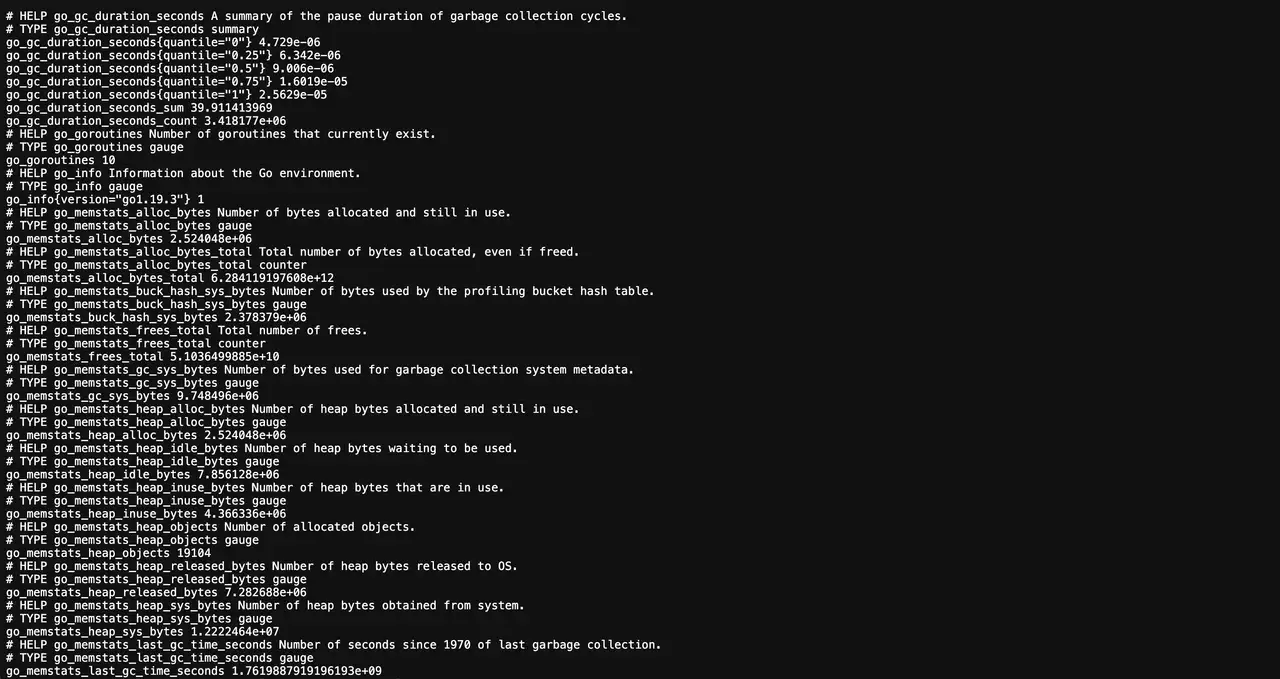
安裝完成後,Node Exporter 在埠 9100 上釋出指標。Prometheus 應該抓取此端點以供儀表板和告警使用。
bash
✅ Installation completed successfully!

🌐 Access Information:

Node Exporter URL: http://1.1.1.1:9100/metrics
✅ Installation completed successfully!
🌐 Access Information:
Node Exporter URL: http://1.1.1.1:9100/metrics儀表板
訪問
http://1.1.1.1:9100/metrics 確認原始輸出,然後在 Prometheus 中新增目標並使用預定義的 Grafana 儀表板(例如 Node Exporter Full)來視覺化主機健康狀況。