

SLV Install - Prometheus
SLV Install - Prometheus
為什麼選擇 Prometheus?
Prometheus 是時間序列監控的事實標準,使用強大的查詢語言(PromQL)和豐富的 Exporter 生態系統來收集指標。透過
slv install 安裝可以為您提供一致的指標骨幹,供 Grafana 儀表板和告警規則在所有環境中使用。亮點
- Prometheus:https://prometheus.io/
- 基於拉取的抓取方式使可觀測性流量可預測,同時 PromQL 可以發現可操作的洞察。
- 與 Grafana 和 Alertmanager 原生整合,無需額外設定即可進行視覺化和通知。
執行安裝程式
將目標主機指向要執行 Prometheus 的主機,並從元件選擇器中選擇它。
bash
$ slv install -i 1.1.1.1,
🚀 Installing software components...
? Select Software Component to Install (Redis)
  Redis
  TiDB (MySQL Cluster)
  Grafana
❯ Prometheus
  Node Exporter
  Kafka Cluster
$ slv install -i 1.1.1.1,
🚀 Installing software components...
? Select Software Component to Install (Redis)
Redis
TiDB (MySQL Cluster)
Grafana
❯ Prometheus
Node Exporter
Kafka Cluster注意:請將1.1.1.1替換為您自己伺服器的 IP 地址。
檢視詳細資訊
在 Playbook 啟動之前,確認清單、Playbook 路徑和可選的限制。
bash
🚀 Installing software components...
? Select Software Component to Install (Redis) › Prometheus
✅ You selected: Prometheus

📋 Installation Details:
Software: Prometheus
Inventory: 1.1.1.1,
Playbook: /Users/fumi/.slv/template/0.9.800/ansible/cmn/software/install-prometheus.yml
? Do you want to proceed with the installation? (y/N) ›
🚀 Installing software components...
? Select Software Component to Install (Redis) › Prometheus
✅ You selected: Prometheus
📋 Installation Details:
Software: Prometheus
Inventory: 1.1.1.1,
Playbook: /Users/fumi/.slv/template/0.9.800/ansible/cmn/software/install-prometheus.yml
? Do you want to proceed with the installation? (y/N) ›觀察 Ansible 執行
slv 利用 Ansible 將 Prometheus 安裝為 systemd 服務並放入基線配置。bash
🚀 Running ansible: ansible-playbook -i 1.1.1.1, -u solv /Users/fumi/.slv/template/0.9.800/ansible/cmn/software/install-prometheus.yml

PLAY [Install and configure Prometheus] **************************************************************

TASK [Gathering Facts] *******************************************************************************
🚀 Running ansible: ansible-playbook -i 1.1.1.1, -u solv /Users/fumi/.slv/template/0.9.800/ansible/cmn/software/install-prometheus.yml
PLAY [Install and configure Prometheus] **************************************************************
TASK [Gathering Facts] *******************************************************************************驗證端點
完成後,CLI 會列印 Prometheus Web UI URL,以便您確認目標正在正確抓取。
bash
✅ Installation completed successfully!

🌐 Access Information:

Prometheus URL: http://1.1.1.1:3090
✅ Installation completed successfully!
🌐 Access Information:
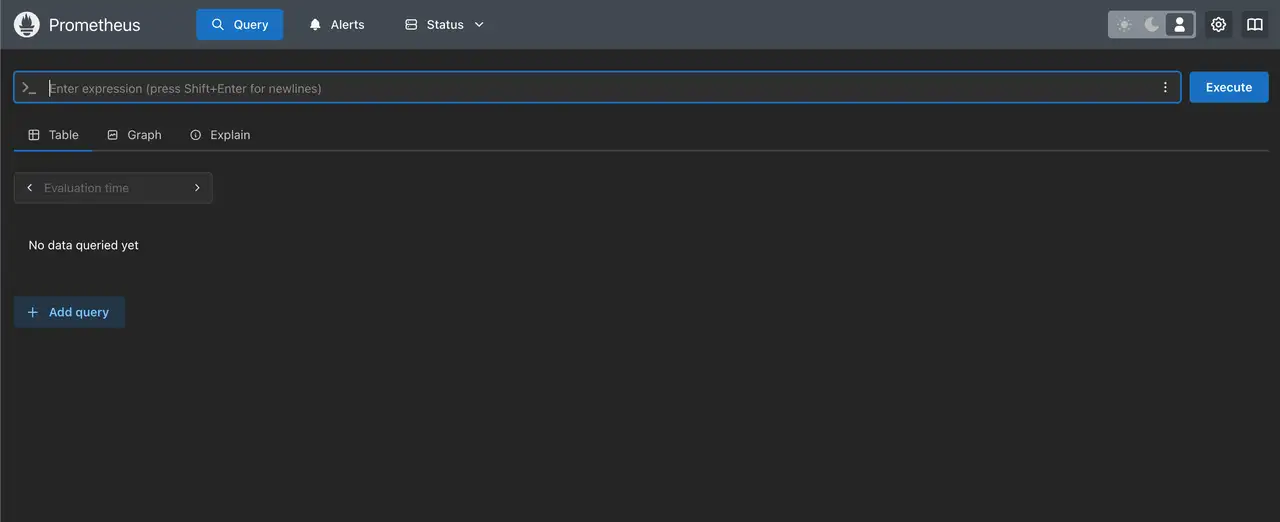
Prometheus URL: http://1.1.1.1:3090儀表板
開啟
http://1.1.1.1:3090 驗證 Prometheus 目標頁面。將其與 Grafana 配合使用,透過 PromQL 繪製指標圖表並透過 Alertmanager 設定告警規則。