

SLV Install - Grafana
SLV Install - Grafana
為什麼選擇 Grafana?
Grafana 將指標、日誌和鏈路追蹤集中到豐富的儀表板中,使運維人員能夠一目瞭然地瞭解基礎設施健康狀況。使用
slv install 部署可以為每個環境提供相同的可觀測性堆疊,無需手動配置。亮點
- Grafana:https://grafana.com/
- 構建可複用的儀表板和告警,即時發現驗證者或 RPC 效能問題。
- 開箱即用地連線 Prometheus、Loki、MySQL 和數十種其他資料來源。
執行安裝程式
將
slv install 指向要部署 Grafana 的主機,並從元件列表中選擇它。bash
$ slv install -i 1.1.1.1,
🚀 Installing software components...
? Select Software Component to Install (Redis)
  Redis
  TiDB (MySQL Cluster)
❯ Grafana
  Prometheus
  Node Exporter
  Kafka Cluster
$ slv install -i 1.1.1.1,
🚀 Installing software components...
? Select Software Component to Install (Redis)
Redis
TiDB (MySQL Cluster)
❯ Grafana
Prometheus
Node Exporter
Kafka Cluster注意:請將1.1.1.1替換為您自己伺服器的 IP 地址。
檢視詳細資訊
在啟動 Ansible 之前,驗證清單和 Playbook 路徑。如果目標主機或配置看起來不正確,請在此取消。
bash
🚀 Installing software components...
? Select Software Component to Install (Redis) › Grafana
✅ You selected: Grafana

📋 Installation Details:
Software: Grafana
Inventory: 1.1.1.1,
Playbook: /Users/fumi/.slv/template/0.9.800/ansible/cmn/software/install-grafana.yml
? Do you want to proceed with the installation? (y/N) ›
🚀 Installing software components...
? Select Software Component to Install (Redis) › Grafana
✅ You selected: Grafana
📋 Installation Details:
Software: Grafana
Inventory: 1.1.1.1,
Playbook: /Users/fumi/.slv/template/0.9.800/ansible/cmn/software/install-grafana.yml
? Do you want to proceed with the installation? (y/N) ›觀察 Ansible 執行
確認後,
slv 執行 Grafana Playbook 並將服務配置為原生 Linux 守護程序。bash
🚀 Running ansible: ansible-playbook -i 1.1.1.1, -u solv /Users/fumi/.slv/template/0.9.800/ansible/cmn/software/install-grafana.yml

PLAY [Install and configure Grafana] ****************************************************************

TASK [Gathering Facts] *******************************************************************************
🚀 Running ansible: ansible-playbook -i 1.1.1.1, -u solv /Users/fumi/.slv/template/0.9.800/ansible/cmn/software/install-grafana.yml
PLAY [Install and configure Grafana] ****************************************************************
TASK [Gathering Facts] *******************************************************************************驗證端點
安裝成功後,會顯示 Grafana 登入 URL 和預設憑據,以便您可以立即登入。
bash
✅ Installation completed successfully!

🌐 Access Information:

Grafana URL: http://1.1.1.1:3000/login

🔑 Default credentials
Username: admin
Password: admin
✅ Installation completed successfully!
🌐 Access Information:
Grafana URL: http://1.1.1.1:3000/login
🔑 Default credentials
Username: admin
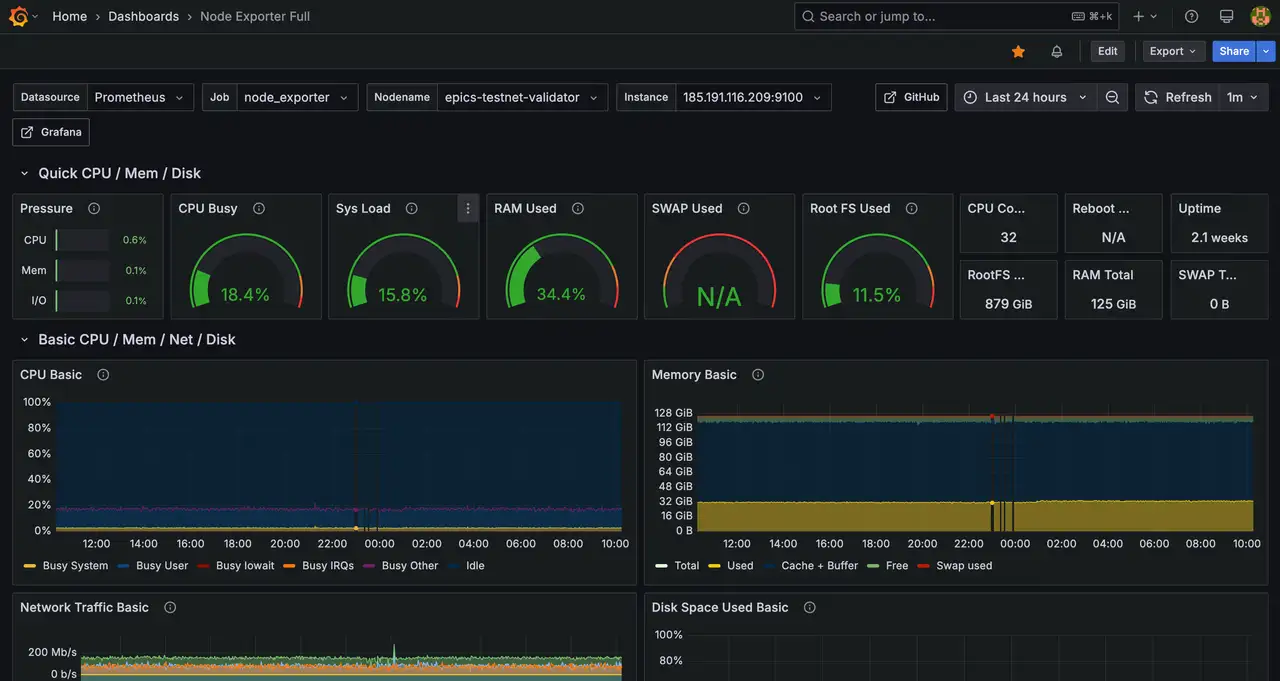
Password: admin儀表板
在
http://1.1.1.1:3000/login 登入並匯入您的儀表板或將 Prometheus 連線為資料來源。建議在配置完成後擷取主儀表板的截圖,用於內部執行手冊。