

SLV Install - Grafana
SLV Install - Grafana
Warum Grafana?
Grafana zentralisiert Metriken, Protokolle und Spuren in reiche Dashboards, so dass Betreiber die Infrastruktur Gesundheit auf einen Blick verstehen können. Bereitstellung mit
slv install gibt jeder Umgebung den gleichen Beobachtungsstapel ohne manuelle Bereitstellung.Highlights
- Grafana: https://grafana.com/
- Erstellen Sie wiederverwendbare Dashboards und Warnungen, dass Oberflächenvalidierer oder RPC-Leistung Probleme sofort.
- Verbindet sich mit Prometheus, Loki, MySQL und Dutzenden anderen Datenquellen aus dem Feld.
Führen Sie den Installer aus
Punkt
slv install bei dem Host, der dazu bestimmt ist, Grafana zu dienen und aus der Komponentenliste auszuwählen.bash
$ slv install -i 1.1.1.1,
🚀 Installing software components...
? Select Software Component to Install (Redis)
  Redis
  TiDB (MySQL Cluster)
❯ Grafana
  Prometheus
  Node Exporter
  Kafka Cluster
$ slv install -i 1.1.1.1,
🚀 Installing software components...
? Select Software Component to Install (Redis)
Redis
TiDB (MySQL Cluster)
❯ Grafana
Prometheus
Node Exporter
Kafka ClusterHinweis: Ersatz1.1.1.1mit der IP-Adresse Ihres eigenen Servers.
Überprüfen Sie die Details
Validieren Sie den Inventar- und Spielbuchpfad, bevor Sie Ansible starten. Abbrechen Sie hier, wenn der Ziel-Host oder die Konfiguration falsch aussieht.
bash
🚀 Installing software components...
? Select Software Component to Install (Redis) › Grafana
✅ You selected: Grafana

📋 Installation Details:
Software: Grafana
Inventory: 1.1.1.1,
Playbook: /Users/fumi/.slv/template/0.9.800/ansible/cmn/software/install-grafana.yml
? Do you want to proceed with the installation? (y/N) ›
🚀 Installing software components...
? Select Software Component to Install (Redis) › Grafana
✅ You selected: Grafana
📋 Installation Details:
Software: Grafana
Inventory: 1.1.1.1,
Playbook: /Users/fumi/.slv/template/0.9.800/ansible/cmn/software/install-grafana.yml
? Do you want to proceed with the installation? (y/N) › Beachten Sie die ansible Execution
Nach Bestätigung,
slv führt das Grafana-Playbook und konfiguriert den Dienst als nativer Linux-Daemon.bash
🚀 Running ansible: ansible-playbook -i 1.1.1.1, -u solv /Users/fumi/.slv/template/0.9.800/ansible/cmn/software/install-grafana.yml

PLAY [Install and configure Grafana] ****************************************************************

TASK [Gathering Facts] *******************************************************************************
🚀 Running ansible: ansible-playbook -i 1.1.1.1, -u solv /Users/fumi/.slv/template/0.9.800/ansible/cmn/software/install-grafana.yml
PLAY [Install and configure Grafana] ****************************************************************
TASK [Gathering Facts] *******************************************************************************Verifizieren Sie den Endpunkt
Erfolgreiche Installationen beenden mit der Grafana-Login-URL und Standard-Anmeldeinformationen, damit Sie sich sofort anmelden können.
bash
✅ Installation completed successfully!

🌐 Access Information:

Grafana URL: http://1.1.1.1:3000/login

🔑 Default credentials
Username: admin
Password: admin
✅ Installation completed successfully!
🌐 Access Information:
Grafana URL: http://1.1.1.1:3000/login
🔑 Default credentials
Username: admin
Password: adminDas ist alles
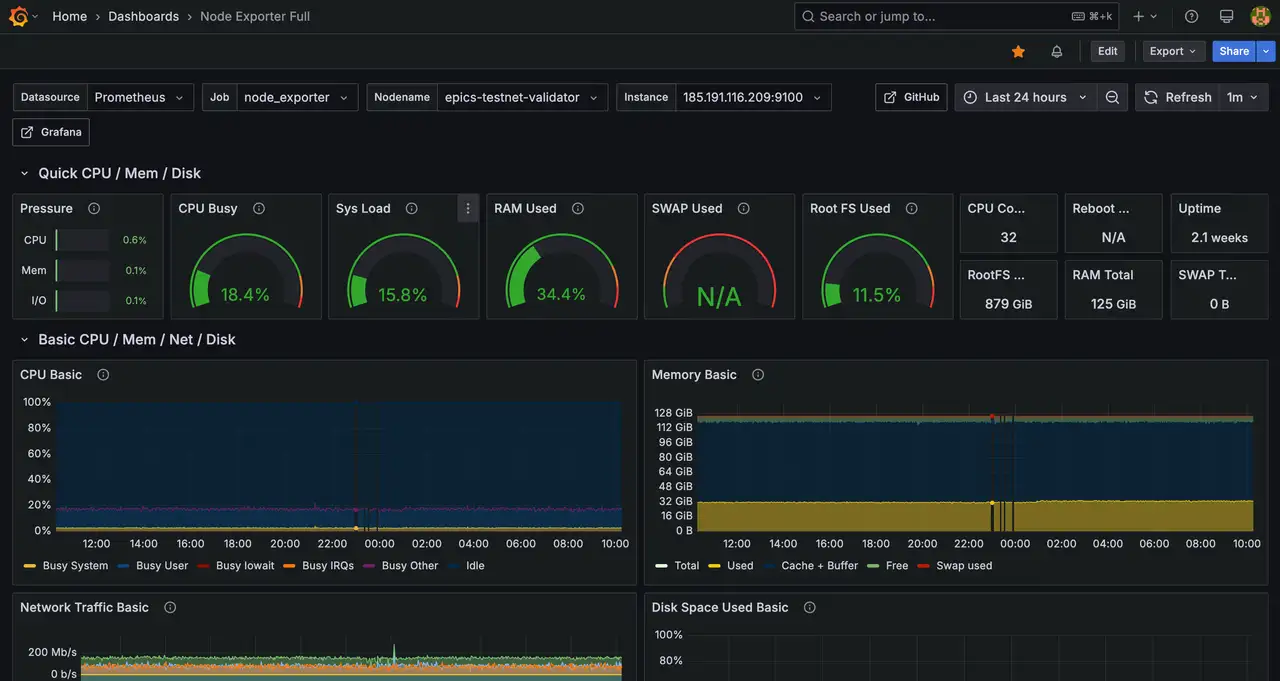
Anmeldung bei
http://1.1.1.1:3000/login und importieren Sie Ihre Dashboards oder verbinden Sie Prometheus als Datenquelle. Betrachten Sie die Aufnahme eines Screenshots Ihres primären Dashboards, das einmal für interne Runbooks konfiguriert wurde.