

SLV Installation - Prometheus
SLV Installation - Prometheus
Warum Prometheus?
Prometheus ist der De-facto-Standard für die Zeitreihenüberwachung, das Sammeln von Metriken mit einer leistungsstarken Abfragesprache (PromQL) und einem reichen Ökosystem von Exporteuren. Installieren über
slv install gibt Ihnen ein konsistentes Metrik-Backbone, das Grafana Dashboards und Warnregeln in jeder Umgebung füttert.Highlights
- Prometheus: https://prometheus.io/
- Pull-basiertes Abstreifen hält Beobachtungs-Verkehr vorhersehbar, während PromQL-Oberflächen akzeptable Einblicke.
- Native Integration mit Grafana und Alertmanager, so dass Sie ohne zusätzliche Einrichtung visualisieren und benachrichtigen können.
Führen Sie den Installer aus
Zielen Sie den Host, der Prometheus ausführen sollte und wählen Sie ihn aus dem Komponentenwähler.
bash
$ slv install -i 1.1.1.1,
🚀 Installing software components...
? Select Software Component to Install (Redis)
  Redis
  TiDB (MySQL Cluster)
  Grafana
❯ Prometheus
  Node Exporter
  Kafka Cluster
$ slv install -i 1.1.1.1,
🚀 Installing software components...
? Select Software Component to Install (Redis)
Redis
TiDB (MySQL Cluster)
Grafana
❯ Prometheus
Node Exporter
Kafka ClusterHinweis: Ersatz1.1.1.1mit der IP-Adresse Ihres eigenen Servers.
Überprüfen Sie die Details
Bestätigen Sie die Inventar-, Playbook-Pfade und optionale Limits, bevor das Playbook startet.
bash
🚀 Installing software components...
? Select Software Component to Install (Redis) › Prometheus
✅ You selected: Prometheus

📋 Installation Details:
Software: Prometheus
Inventory: 1.1.1.1,
Playbook: /Users/fumi/.slv/template/0.9.800/ansible/cmn/software/install-prometheus.yml
? Do you want to proceed with the installation? (y/N) ›
🚀 Installing software components...
? Select Software Component to Install (Redis) › Prometheus
✅ You selected: Prometheus
📋 Installation Details:
Software: Prometheus
Inventory: 1.1.1.1,
Playbook: /Users/fumi/.slv/template/0.9.800/ansible/cmn/software/install-prometheus.yml
? Do you want to proceed with the installation? (y/N) › Beachten Sie die ansible Execution
slv Ansible, um Prometheus als systemd Dienst zu installieren und die Basiskonfiguration zu fallen.bash
🚀 Running ansible: ansible-playbook -i 1.1.1.1, -u solv /Users/fumi/.slv/template/0.9.800/ansible/cmn/software/install-prometheus.yml

PLAY [Install and configure Prometheus] **************************************************************

TASK [Gathering Facts] *******************************************************************************
🚀 Running ansible: ansible-playbook -i 1.1.1.1, -u solv /Users/fumi/.slv/template/0.9.800/ansible/cmn/software/install-prometheus.yml
PLAY [Install and configure Prometheus] **************************************************************
TASK [Gathering Facts] *******************************************************************************Verifizieren Sie den Endpunkt
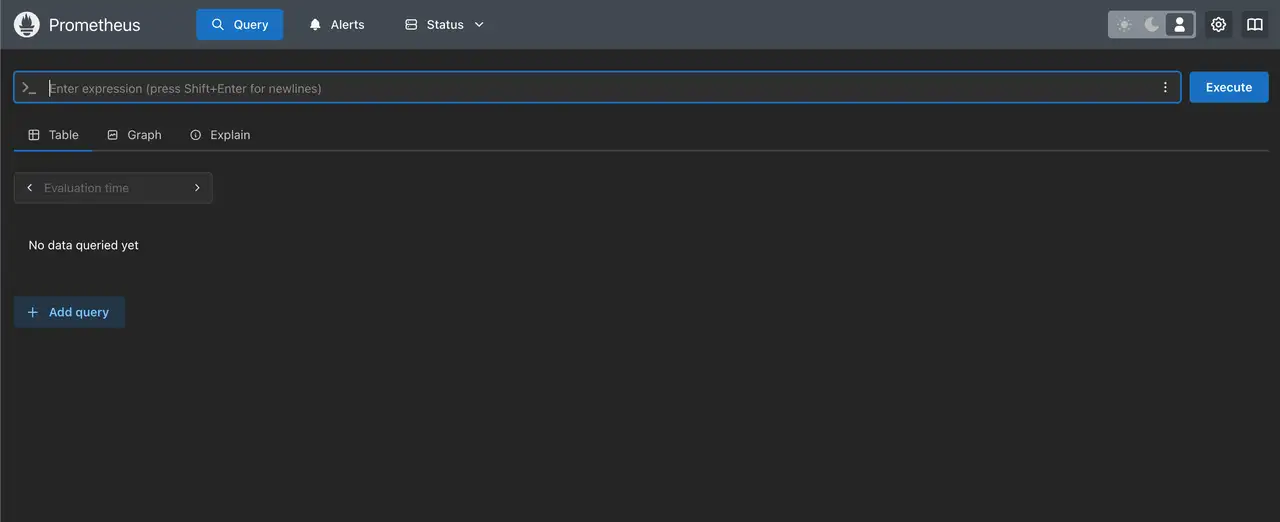
Nach Fertigstellung druckt der CLI die Prometheus Web UI URL, so dass Sie bestätigen können, dass die Ziele korrekt scrapen.
bash
✅ Installation completed successfully!

🌐 Access Information:

Prometheus URL: http://1.1.1.1:3090
✅ Installation completed successfully!
🌐 Access Information:
Prometheus URL: http://1.1.1.1:3090Das ist alles
Öffnen
http://1.1.1.1:3090 um die Prometheus Zielseite zu überprüfen. Kombinieren Sie es mit Grafana, um Metriken mit PromQL zu graphieren und Alarmregeln durch Alertmanager einzurichten.