

SLV Install - Node Exporter
SLV Install - Node Exporter
Warum Node Exporteur?
Node Exporter zeigt detaillierte Hardware- und OS-Metriken – CPU, Speicher, Festplatte, Netzwerk – so können Prometheus und Grafana auf Infrastrukturprobleme aufmerksam machen, bevor sie Solana-Workloads beeinflussen. Installieren über
slv install stellt sicher, dass jeder Server eine konsequente Reihe von Systemmetriken ohne manuelle Einrichtung gibt bekannt.Highlights
- Node Exporter: https://github.com/prometheus/node_exporter
- Leicht binär mit minimalem Overhead, perfekt für Bare Metal- oder VPS-Hosts.
- Bietet die Basis Metriken Dashboards und Warnungen verlassen sich auf über Prometheus/Grafana.
Führen Sie den Installer aus
Punkt
slv install bei dem Host, den Sie Node Exporter aus der Liste überwachen und auswählen möchten.bash
$ slv install -i 1.1.1.1,
🚀 Installing software components...
? Select Software Component to Install (Redis)
  Redis
  TiDB (MySQL Cluster)
  Grafana
  Prometheus
❯ Node Exporter
  Kafka Cluster
$ slv install -i 1.1.1.1,
🚀 Installing software components...
? Select Software Component to Install (Redis)
Redis
TiDB (MySQL Cluster)
Grafana
Prometheus
❯ Node Exporter
Kafka ClusterHinweis: Ersatz1.1.1.1mit der IP-Adresse Ihres eigenen Servers.
Überprüfen Sie die Details
Verwenden Sie den Details-Bildschirm, um das richtige Inventar und Spielbuch zu bestätigen, bevor Ansible beginnt.
bash
🚀 Installing software components...
? Select Software Component to Install (Redis) › Node Exporter
✅ You selected: Node Exporter

📋 Installation Details:
Software: Node Exporter
Inventory: 1.1.1.1,
Playbook: /Users/fumi/.slv/template/0.9.800/ansible/cmn/software/install-node-exporter.yml
? Do you want to proceed with the installation? (y/N) ›
🚀 Installing software components...
? Select Software Component to Install (Redis) › Node Exporter
✅ You selected: Node Exporter
📋 Installation Details:
Software: Node Exporter
Inventory: 1.1.1.1,
Playbook: /Users/fumi/.slv/template/0.9.800/ansible/cmn/software/install-node-exporter.yml
? Do you want to proceed with the installation? (y/N) › Beachten Sie die ansible Execution
slv läuft das Node Exporter Playbook und ermöglicht es als systemd service, so dass es automatisch beim Booten beginnt.bash
🚀 Running ansible: ansible-playbook -i 1.1.1.1, -u solv /Users/fumi/.slv/template/0.9.800/ansible/cmn/software/install-node-exporter.yml

PLAY [Install and configure Node Exporter] ***********************************************************

TASK [Gathering Facts] *******************************************************************************
🚀 Running ansible: ansible-playbook -i 1.1.1.1, -u solv /Users/fumi/.slv/template/0.9.800/ansible/cmn/software/install-node-exporter.yml
PLAY [Install and configure Node Exporter] ***********************************************************
TASK [Gathering Facts] *******************************************************************************Verifizieren Sie den Endpunkt
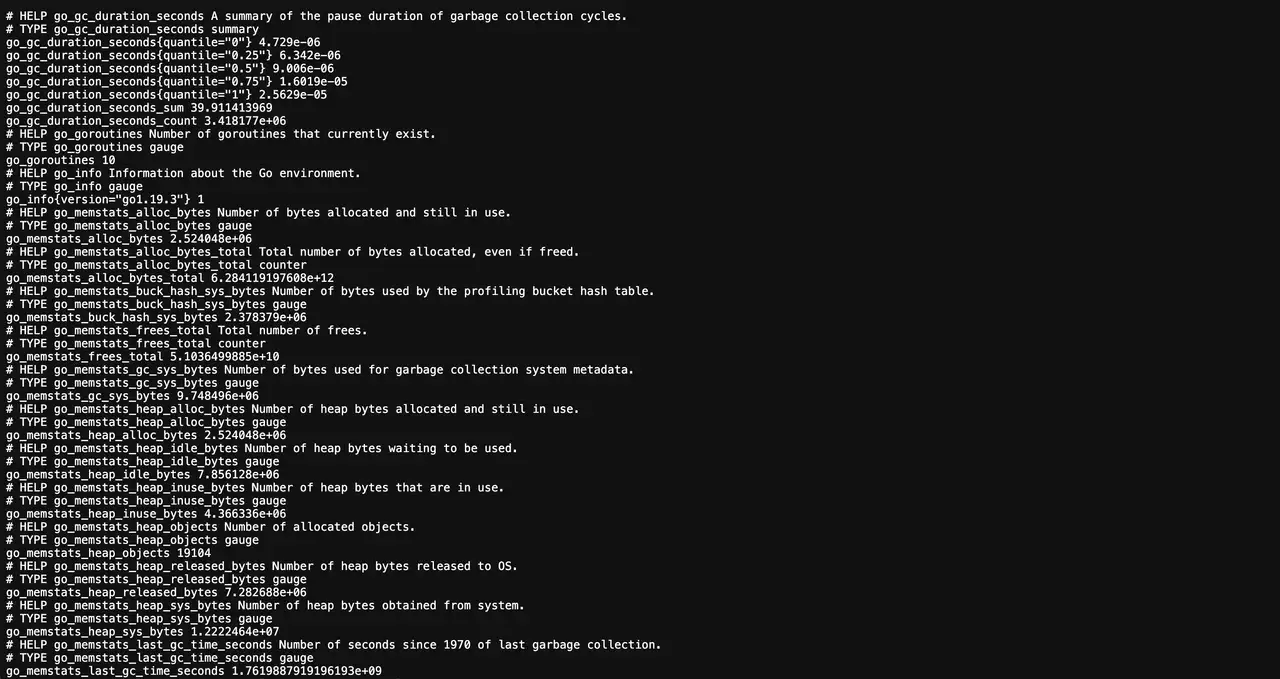
Nach der Installation veröffentlicht Node Exporter Metriken auf Port 9100. Prometheus sollte diesen Endpunkt scrapen, um Dashboards und Alerts zu füttern.
bash
✅ Installation completed successfully!

🌐 Access Information:

Node Exporter URL: http://1.1.1.1:9100/metrics
✅ Installation completed successfully!
🌐 Access Information:
Node Exporter URL: http://1.1.1.1:9100/metricsDas ist alles
Besuchen Sie uns
http://1.1.1.1:9100/metrics um die Rohausgabe zu bestätigen, dann das Ziel in Prometheus hinzufügen und vordefinierte Grafana Dashboards (z. B. Node Exporter Full) gesteckt, um die Host-Gesundheit zu visualisieren.