
Make Your Solana App Faster: Review gRPC Data Volume, Receive Processing and Runtime Resources

The Solana application you are building may be able to run faster. The amount of data it receives, the processing that follows, and resources such as CPU and networking work together. Reviewing that combination may help you get more performance from your existing software.
You have started building HFT on Solana, connected to Geyser gRPC, and can see data in the logs. Yet decisions are not as fast as you expected. Waiting between receipt and a decision can provide clues about where to improve. Start by finding what you can observe in your current code.
At ERPC, conversations and feedback from customers give us opportunities to review delivery, receive settings and application processing. Those insights inform improvements to our delivery and documentation. This article explains the mechanisms and investigation steps so that developers handling high-volume, fast-moving streams for the first time can explore improvements in their own environment.
Start with one small check in your current code
You can look up technical terms and diagnostic commands as they become useful. If you have an AI agent that can read your project's code, try the short request below first. Add where the application runs and when it feels slow. Undecided requirements and unavailable measurements can remain that way while you begin.
text
I want to find out whether my Solana application has room to respond faster.
First, read the current code and identify where data is received and where the decision using that data completes. Keep the subscription unchanged and propose the smallest change that would measure event counts and elapsed time over that interval.
For this first task, show the measurement points, proposed change, what it would reveal and what would remain unmeasured. If host access is unavailable, start with what can be observed inside the application. Do not display secrets, change production or create paid resources.
I want to find out whether my Solana application has room to respond faster.
First, read the current code and identify where data is received and where the decision using that data completes. Keep the subscription unchanged and propose the smallest change that would measure event counts and elapsed time over that interval.
For this first task, show the measurement points, proposed change, what it would reveal and what would remain unmeasured. If host access is unavailable, start with what can be observed inside the application. Do not display secrets, change production or create paid resources.The first useful result is knowing where and what to measure in your own code. Separating observable intervals from unmeasured ones helps you choose what to investigate next. A more detailed prompt for further diagnosis is included later in the article.
For example, an agent might reply: “Reception is in
stream.ts at onData; decision completion is in strategy.ts at onDecisionComplete. I propose a change that aggregates received-event counts, completed-decision counts and elapsed time across this interval. The interval before the callback is outside the scope of this measurement proposal.” These are fictional TypeScript filenames and function names used to illustrate the response. Regardless of language, check that the actual code locations, the records to add and the limits of this measurement correspond. If receptions and decisions are not one-to-one, ask the agent to propose their mapping and the counting unit as well.Add a streaming perspective to your web development experience
Managed services let developers build many web features without thinking about individual server components. That experience remains a foundation for working with Solana streams. Add a view of how much data arrives continuously and how quickly the application processes it.
Connecting an SDK to Solana can look equally straightforward. But subscribing to a broad range of transactions or account updates changes the workload. Bandwidth, CPU and memory requirements depend on the subscription, message sizes, compression, application processing and traffic at the time. There is no single fixed number of megabytes per second for “Solana.”
The starting point is to make the relationship between incoming work and processing capacity something you design for and measure.
A flowing stream can still accumulate a queue
First, compare the data arriving in the same one-second interval using equally sized tiles. Each tile represents 1,000 messages; assuming 1 kB per message, that totals 1 MB. The smaller example receives 2 MB per second and the larger one receives 12 MB per second, while the receiving app has the same processing capacity in both. This is an illustrative model of message payload volume in decimal units, excluding compression and protocol headers.
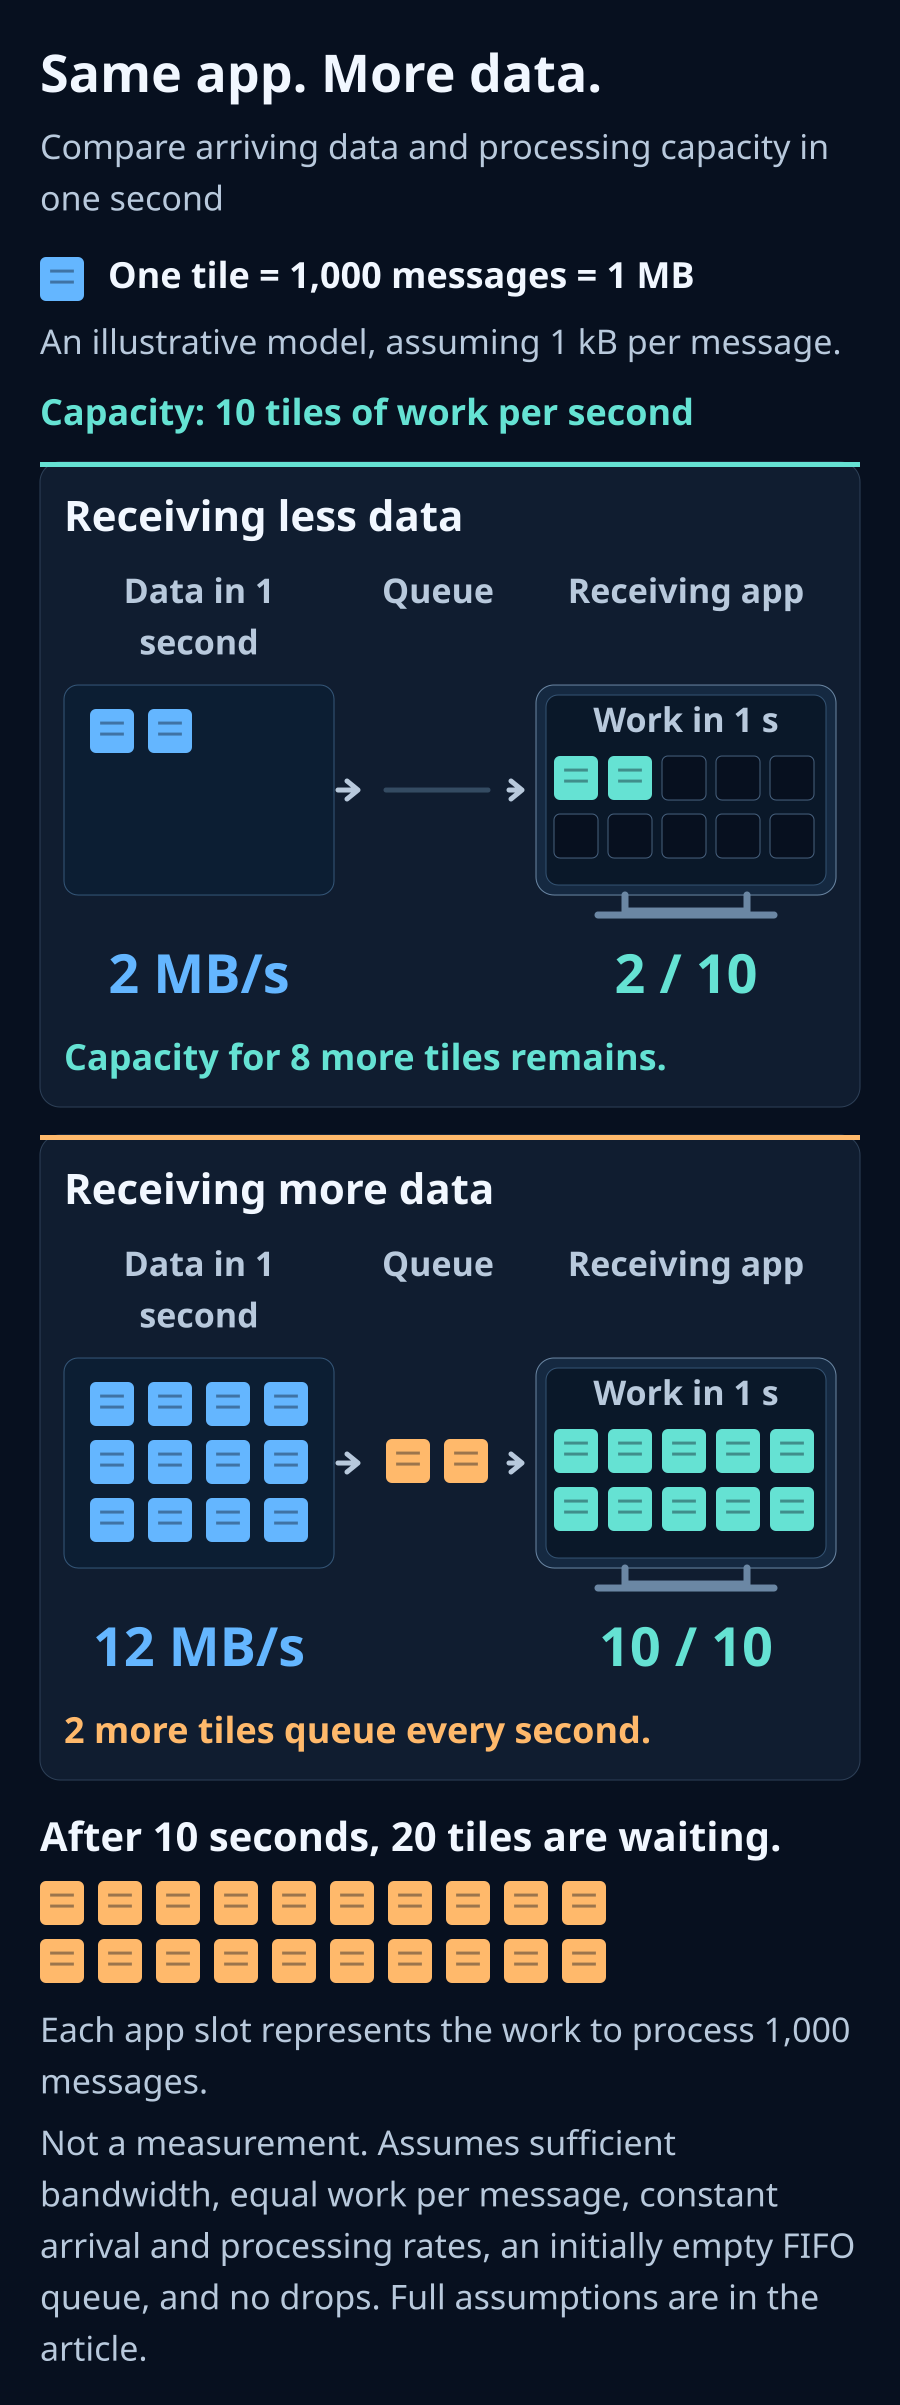
Consider an illustrative model: 12,000 events arrive per second, and a computer can process 10,000 per second. Each event requires the same work, the initial queue is empty, events are processed in arrival order, and none are discarded.
Another 2,000 events remain unprocessed every second. After ten seconds, 20,000 events are waiting. An event joining that queue at that moment waits approximately two seconds before processing begins. Logs keep moving while the queue keeps growing.
These are explanatory assumptions, not measurements of Solana or ERPC. The model assumes constant input and capacity. Real traffic arrives in bursts, and processing costs vary, so waiting can occur even when average capacity is sufficient.
gRPC flow control adjusts transmission to what the receiver can accept. When processing falls behind, waiting can extend beyond an application queue into communication libraries or the sender. A live connection, or a successful write to a sending API, does not establish how fresh the data is when it arrives.[1]
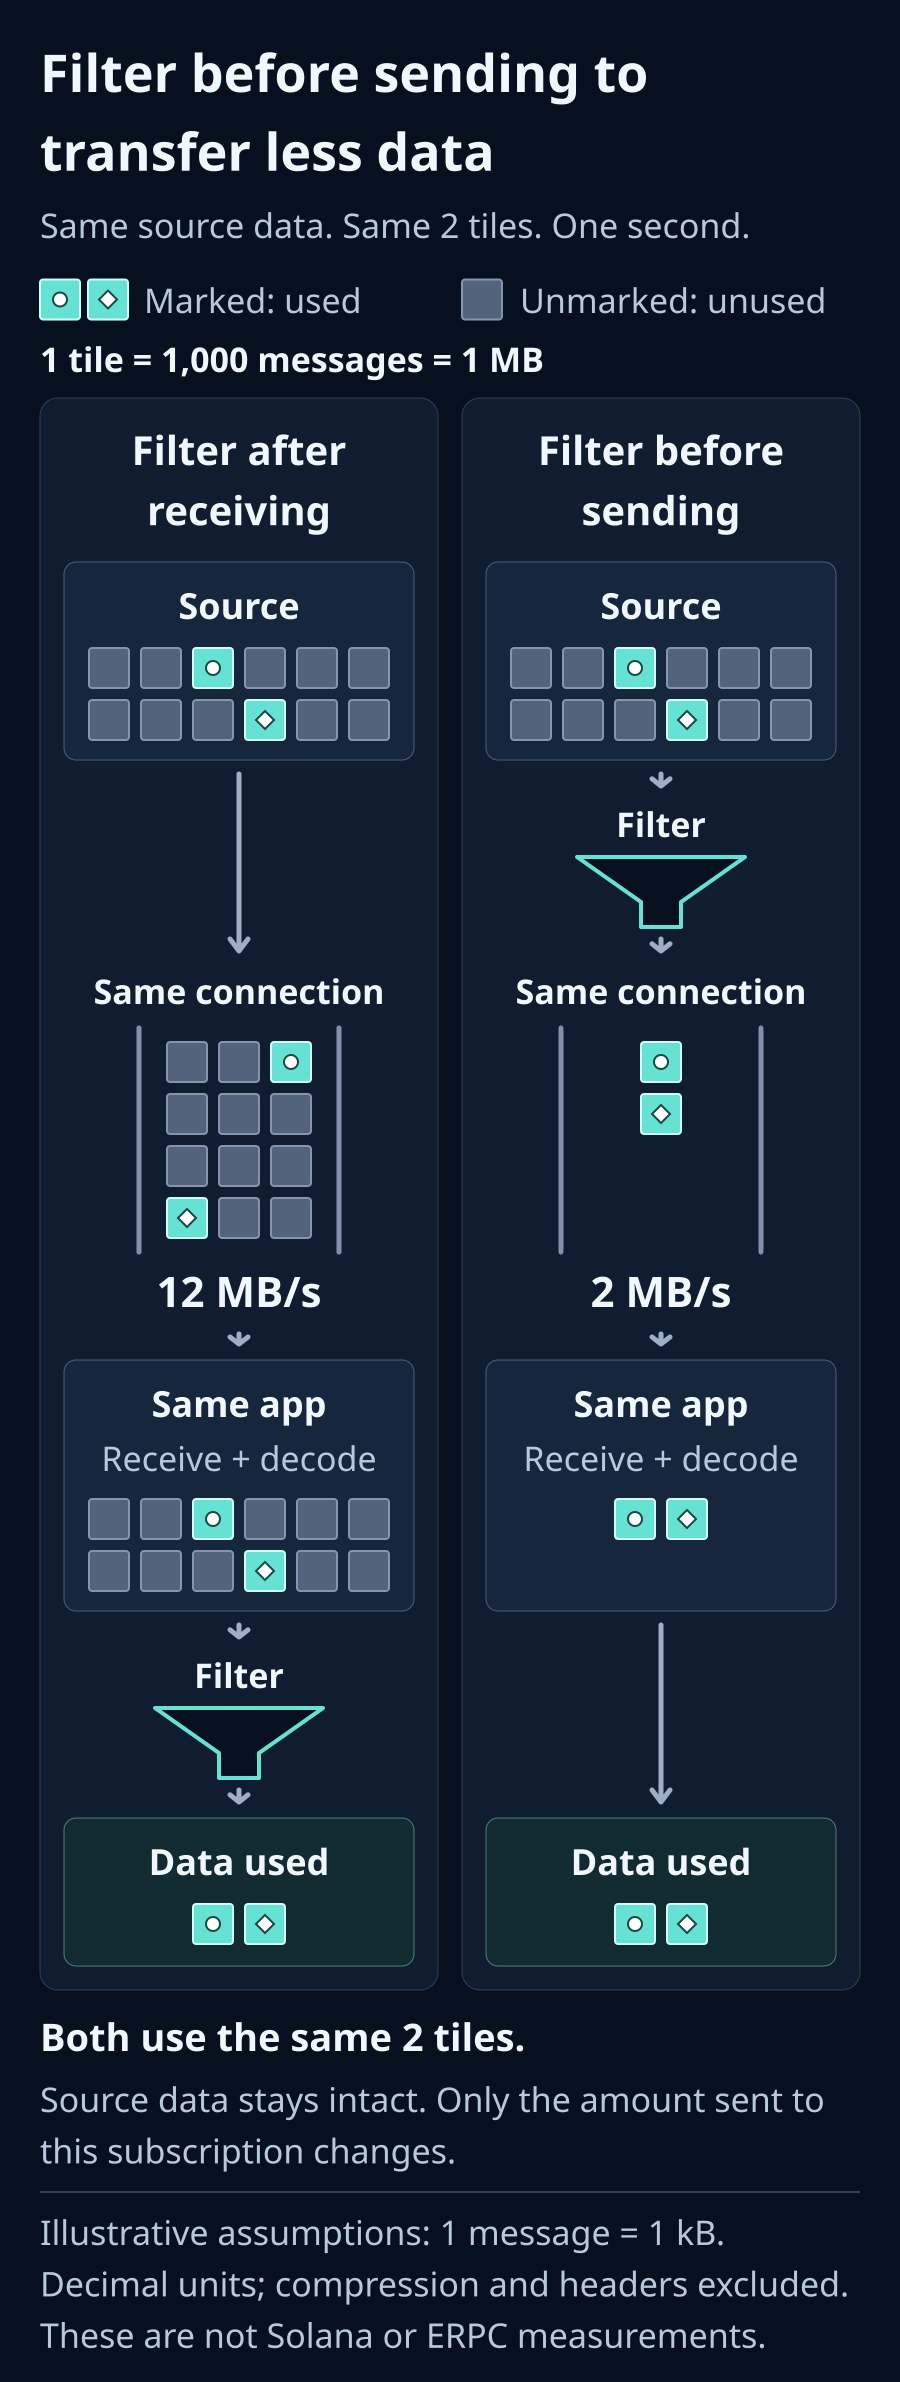
Choose the data you need before it crosses the network
If your decisions need only particular programs or accounts, define that data first and apply server-side subscription filters. Yellowstone gRPC supports filters for transactions and accounts. Check the exact combinations and available scope against the API, SDK and service you use.[2]
If you do not know what to filter, inspect the code to identify the values your application uses for decisions and which notification fields provide them. Build candidate subscription conditions from that mapping, then verify that known required events are included. Checking both the reduction in events and the retention of required data gives you a sound basis for the next comparison.
Receiving everything and discarding unwanted data on the client still incurs the transfer, decryption and decoding work up to that point. Filtering at the sender can reduce that work. In the example above, narrowing input to the 2,000 events per second you need gives the same 10,000-event processing capacity room to cope.
Think of traffic: road length represents propagation distance, lanes represent bandwidth, the toll booth represents receiving capacity, and the line of cars represents queued work. Sending only the cars you need through the same booth produces a different queue from directing every nearby car into it. Shortening the road and reducing the number of cars are separate improvements.
Communication also has physical limits. Transferring 100 MB at 1 Gbps takes at least 0.8 seconds in theory; at 10 Gbps, it takes 0.08 seconds. These are lower bounds using decimal units, excluding distance, protocol overhead, retransmissions and queued work. They do not mean that every individual event in a stream is delayed by 0.8 seconds.
Even when one computation is faster than a network exchange, sending unnecessary data still has a cost. Consider propagation time, how much can cross the link per unit of time, and how much work can be completed after arrival.
Some applications, including complete indexes, auditing and research, need all the data. They require receiving, processing and storage capacity for that workload. Receiving all individual notifications also differs from waiting for a full block: data aggregated and reconstructed as a block. Check whether your decision unnecessarily depends on unrelated data or the completion of aggregation.[2]
Review receive processing and runtime resources
Rust can help reduce processing costs. To benefit from that speed, also examine incoming volume, effective link capacity, time spent waiting for database writes, locks and serial sections. In an asynchronous runtime, assigning CPU-intensive work and work that blocks a thread to appropriate parts of the system can also improve the application.[3]
Keep the receive loop short and separate expensive work. Define a queue limit and what happens when the queue is full. An unbounded queue can hide growing delay as growing memory consumption. A bounded queue does not resolve a sustained lack of processing capacity either. Preserve required ordering and completeness while choosing among smaller subscriptions, more efficient processing, partitioning, parallelism and additional resources.
Start by measuring receipt through decision completion, then investigate where waiting appears. The table below gives an initial way to look at each area. Detailed metric names and commands are also included in the diagnostic prompt later, so you can use the items that become relevant.
| Resource | What to check first |
|---|---|
| CPU | Is work concentrated on one core? Check overall and per-core usage, along with CPU limits in the execution environment |
| Memory | Are pending events or memory use continuing to grow? Look at the amount of queued data together with the oldest event's waiting time |
| Disk and database | Is receiving waiting for storage to finish? Check database writes and storage waits. If the application does not persist data, other areas offer a starting point |
| Network | Do the link and its settings fit the incoming volume? Check actual transfer rates, round-trip time and retransmissions |
When you investigate communication in more detail, library settings can provide further clues. HTTP/2 has flow-control windows at both stream and connection level that control how much additional data the peer can send. If that allowance is small relative to the bandwidth-delay product, meaning bandwidth multiplied by round-trip time, throughput may reach a ceiling even when the link has headroom. Where this applies, inspect the library and intermediaries, checking the setting's scope and memory cost as you adjust it.[4]
Measure freshness and waiting as well as receipt
To start checking for backlog inside the application, keep the current subscription and record received events, completed events, queue count and the oldest event's wait over the same observation period. If you do not know where to measure, use the prompt below to have an agent inspect the code. If there is no explicit queue, start with the time from receipt to decision completion and compare it with a diagnostic version that removes expensive processing.
The following language- and SDK-independent pseudocode shows where the measurements belong. Preserve the current processing order and concurrency as you add instrumentation to the actual code.
text
When data is received:
  Increase the received-event count by 1
  Record a monotonic receive timestamp associated with that event
  Pass it into the existing processing

When the decision using the same event completes:
  Increase the completed-event count by 1
  Calculate and aggregate the elapsed time since receipt
When data is received:
Increase the received-event count by 1
Record a monotonic receive timestamp associated with that event
Pass it into the existing processing
When the decision using the same event completes:
Increase the completed-event count by 1
Calculate and aggregate the elapsed time since receiptIf reception and decisions do not have a one-to-one relationship, first define that mapping and the unit you will count. Summarizing observations over a fixed interval lets you compare results without adding a log message for every event.
For further diagnosis, also record received bytes, queue bytes, processing-time p50/p95/p99, errors and reconnections. The p99 is the threshold at or below which 99% of the measured processing times fall. Identify where each measurement is taken. NIC traffic, Protobuf size and decoded object size are different quantities.
Use a monotonic clock for elapsed times on one host, separating receipt, enqueue, dequeue and completion. If decoding has already happened when an SDK callback runs, the interval before that callback is unmeasured. For comparisons with a sender timestamp, verify clock synchronization and where that timestamp is generated. Do not automatically call the difference pure network latency.
If waiting decreases when business processing is removed without changing the subscription, that is a clue to investigate the effect of adding that processing. Fast work after the callback alone does not prove that the data arrived fresh.
You can also compare event identifiers against a reference stream with the same subscription and commitment, meaning the confirmation stage of the data you use. Verify that the reference itself is not accumulating a backlog. A slot gap alone does not prove missing data or translate into a fixed number of seconds: some slots contain no matching event, and slots can be skipped.[5]
mtr helps investigate route latency and response patterns. Loss at an intermediate hop alone can reflect a router limiting its replies. Correlate behavior through to the destination with TCP retransmissions, effective transfer rates and another route. mtr alone cannot establish bandwidth exhaustion or a data center fault.[6]
A diagnostic prompt for your AI agent
Give the following to an agent that can read your project's code. Start by saying where it runs and when and how it feels slow. The agent can first investigate the connection, subscription and processing after receipt from the code. There is no need to paste API keys or credentials into the conversation.
If the required events or acceptable delay are not yet defined, say that they are undecided. Explain in your own words what information you want to observe and what decisions you want to make. Treat unavailable measurements as unmeasured and begin with what you can inspect now.
text
Investigate whether my Solana Geyser gRPC client has room to respond faster. If delay, backlog or disconnections are present, isolate their causes and help improve them. Do not infer that current data is being processed just because the connection succeeds or logs show events. Do not decide in advance that either the client or the provider is at fault.

1. Establish the goal: required events, acceptable freshness, ordering and loss requirements, subscription filters, commitment, endpoint region, actual language/SDK/gRPC-library versions, and runtime environment. Inspect available code, configuration and lockfiles first; ask only for missing information. Leave undecided requirements explicitly undecided and investigate the current state first. Do not display secrets, and redact shared logs.

2. Measure receipt through completion. Prioritize receipt, completion and waiting times, starting with what can be measured. Record events/second, bytes/second, completed events/second, queue count/bytes/oldest-event wait, p50/p95/p99, errors, disconnects, reconnections and drops. If there is no explicit queue, state that and identify the processing intervals you can observe. State observation points and unmeasured intervals. Distinguish NIC traffic, wire bytes, Protobuf size and decoded objects. Use a monotonic clock for local elapsed time; verify synchronization and timestamp origin for external times. Do not convert a slot gap directly into data loss or a fixed duration.

3. Separate CPU, memory, disk and network constraints. Inspect per-core/thread CPU, steal and CPU limits, RSS/GC/swap/PSI, I/O waits, NIC bytes/drops/errors, TCP retransmissions and RTT. Possible Linux tools include mpstat, pidstat, vmstat, iostat, sar, ss -ti and /proc/pressure/. If tools or permissions are missing, say so and provide the minimum required commands. If host access is unavailable, look for information in the management console or application instrumentation and mark unavailable quantities as unmeasured. Never invent results.

4. Inspect both HTTP/2 stream and connection windows, TCP receive buffers, proxies, VPNs and sidecars. Check official documentation for the installed SDK version and consider the bandwidth-delay product. Inspect JSON conversion, per-event logging, synchronous database/external API calls, blocking work, locks, unlimited task creation and unbounded queues in or around the receive loop. Do not treat Rust or async code alone as a solution.

5. Where mtr or an equivalent is available, run a finite measurement to the actual endpoint host. On supported systems consider: mtr --tcp --port <PORT> --report --report-cycles 30 <HOST>. Use the actual port rather than assuming a standard TLS port. Do not label intermediate-hop loss alone a fault; compare destination behavior, retransmissions and other routes. Do not use mtr as a substitute for bandwidth measurement.

6. Record a baseline with the current subscription and change one variable at a time. Keep the same subscription when comparing a minimal receiving path with the pipeline that includes business processing. Treat filter changes as a separate comparison. Before narrowing the subscription, map decision inputs to their notifications and verify that candidate filters include known required events. Design bounded queues and parallelism that preserve required ordering and completeness, and specify overflow behavior. Do not silently discard required data. Save full error details and retry deadlines; do not reconnect during an imposed pause.

7. Report observed facts, candidate causes, untested hypotheses, reviewable changes and before/after measurements separately. Estimate CPU, RAM, bandwidth, storage performance and placement from the subscription and measurements, including peak headroom. Do not invent a fixed universal Solana hardware requirement. If needed, propose comparing machines/data centers using the same subscription, SDK and commitment.

If I use ERPC, read its current gRPC FAQ and follow the instructions for the exact error code:
https://erpc.global/en/faq/grpc/general/
If ERPC User MCP or a CLI is connected, verify the operations and permissions actually available. Account access does not imply access to host diagnostics. Before creating a paid VPS, changing a contract, updating production or restarting it, present the cost, purpose and test duration and obtain my approval. Complete diagnosis and reviewable improvements first.
Investigate whether my Solana Geyser gRPC client has room to respond faster. If delay, backlog or disconnections are present, isolate their causes and help improve them. Do not infer that current data is being processed just because the connection succeeds or logs show events. Do not decide in advance that either the client or the provider is at fault.
1. Establish the goal: required events, acceptable freshness, ordering and loss requirements, subscription filters, commitment, endpoint region, actual language/SDK/gRPC-library versions, and runtime environment. Inspect available code, configuration and lockfiles first; ask only for missing information. Leave undecided requirements explicitly undecided and investigate the current state first. Do not display secrets, and redact shared logs.
2. Measure receipt through completion. Prioritize receipt, completion and waiting times, starting with what can be measured. Record events/second, bytes/second, completed events/second, queue count/bytes/oldest-event wait, p50/p95/p99, errors, disconnects, reconnections and drops. If there is no explicit queue, state that and identify the processing intervals you can observe. State observation points and unmeasured intervals. Distinguish NIC traffic, wire bytes, Protobuf size and decoded objects. Use a monotonic clock for local elapsed time; verify synchronization and timestamp origin for external times. Do not convert a slot gap directly into data loss or a fixed duration.
3. Separate CPU, memory, disk and network constraints. Inspect per-core/thread CPU, steal and CPU limits, RSS/GC/swap/PSI, I/O waits, NIC bytes/drops/errors, TCP retransmissions and RTT. Possible Linux tools include mpstat, pidstat, vmstat, iostat, sar, ss -ti and /proc/pressure/. If tools or permissions are missing, say so and provide the minimum required commands. If host access is unavailable, look for information in the management console or application instrumentation and mark unavailable quantities as unmeasured. Never invent results.
4. Inspect both HTTP/2 stream and connection windows, TCP receive buffers, proxies, VPNs and sidecars. Check official documentation for the installed SDK version and consider the bandwidth-delay product. Inspect JSON conversion, per-event logging, synchronous database/external API calls, blocking work, locks, unlimited task creation and unbounded queues in or around the receive loop. Do not treat Rust or async code alone as a solution.
5. Where mtr or an equivalent is available, run a finite measurement to the actual endpoint host. On supported systems consider: mtr --tcp --port <PORT> --report --report-cycles 30 <HOST>. Use the actual port rather than assuming a standard TLS port. Do not label intermediate-hop loss alone a fault; compare destination behavior, retransmissions and other routes. Do not use mtr as a substitute for bandwidth measurement.
6. Record a baseline with the current subscription and change one variable at a time. Keep the same subscription when comparing a minimal receiving path with the pipeline that includes business processing. Treat filter changes as a separate comparison. Before narrowing the subscription, map decision inputs to their notifications and verify that candidate filters include known required events. Design bounded queues and parallelism that preserve required ordering and completeness, and specify overflow behavior. Do not silently discard required data. Save full error details and retry deadlines; do not reconnect during an imposed pause.
7. Report observed facts, candidate causes, untested hypotheses, reviewable changes and before/after measurements separately. Estimate CPU, RAM, bandwidth, storage performance and placement from the subscription and measurements, including peak headroom. Do not invent a fixed universal Solana hardware requirement. If needed, propose comparing machines/data centers using the same subscription, SDK and commitment.
If I use ERPC, read its current gRPC FAQ and follow the instructions for the exact error code:
https://erpc.global/en/faq/grpc/general/
If ERPC User MCP or a CLI is connected, verify the operations and permissions actually available. Account access does not imply access to host diagnostics. Before creating a paid VPS, changing a contract, updating production or restarting it, present the cost, purpose and test duration and obtain my approval. Complete diagnosis and reviewable improvements first.Try the same code in a comparable environment
Measurements may reveal opportunities to improve CPU or memory resources or the network path. A stronger CPU, more memory, partitioned work or a location closer to the source are possible options. Connecting those choices to your application's data volume and observations makes both the reason to try them and the effect to check clearer.
ERPC VPS is an option for running stream clients near Solana infrastructure. Hourly billing lets you compare the same code and subscription with your current environment. Check current prices, regions and availability in the Dashboard. On ERPC, too, resource requirements depend on your subscription and application processing.[7]
Compare queue growth, freshness at processing completion, p99 and errors as well as receive throughput. Record the measurement period and chain load. Simultaneous comparisons or repeated measurements help avoid mistaking changes in traffic over time for differences between environments.
For support, share redacted subscription settings, SDK version, region, timestamps, complete error messages and the measurements you have. It is fine to identify values you have not yet obtained as unmeasured.
Each additional observation makes it easier to choose the next change to try. Preserve the data you need and check improvements one step at a time. We will keep improving the information and infrastructure that support your development.
References and related links
- [1] gRPC Flow Control: https://grpc.io/docs/guides/flow-control/
- [2] Yellowstone gRPC subscription specification: https://github.com/rpcpool/yellowstone-grpc/blob/master/README.md
- [3] Tokio: CPU-bound tasks and blocking code: https://docs.rs/tokio/latest/tokio/index.html#cpu-bound-tasks-and-blocking-code
- [4] HTTP/2 flow control: https://www.rfc-editor.org/rfc/rfc9113.html#section-5.2
- [5] Solana terminology: https://solana.com/docs/references/terminology
- [6] Official mtr documentation: https://github.com/traviscross/mtr
- [7] ERPC VPS: https://erpc.global/en/vps/
- Linux PSI: https://docs.kernel.org/accounting/psi.html
- Node.js measurement APIs: https://nodejs.org/api/perf_hooks.html
- ERPC gRPC FAQ: https://erpc.global/en/faq/grpc/general/
- ERPC Web Dashboard: https://dashboard.erpc.global/en/
- Validators DAO official Discord: https://discord.gg/C7ZQSrCkYR