

SLV स्थापित करें - Grafana
SLV स्थापित करें - Grafana
क्यों Grafana?
Grafana मैट्रिक्स, लॉग्स और ट्रेस को समृद्ध डैशबोर्ड में केंद्रीकृत करता है ताकि ऑपरेटर एक नज़र में बुनियादी ढांचे के स्वास्थ्य को समझ सकें। इसे इसके साथ वितरित करना
slv install हर वातावरण को मैनुअल प्रावधान के बिना समान अवलोकन स्टैक देता है।** हाइलाइट्स**
- Grafana: https://grafana.com/
- पुन: प्रयोज्य डैशबोर्ड और अलर्ट बनाएं जो सतह सत्यापनकर्ता या RPC तुरंत प्रदर्शन मुद्दों।
- कनेक्ट PrometheusThe box of the Internet, the Internet, and the Internet, and the Internet, and the Internet, and the Internet, and the Internet, and the Internet, and the Internet, and the Internet, and the Internet, and the Internet, and the Internet, and the Internet, and the Internet, and the Internet, and the Internet, and the Internet, and the Internet, and the Internet, and the Internet, and the Internet, and the Internet, and the Internet, and the Internet, and the Internet, and the Internet, and the Internet, and the Internet, and the Internet, and the Internet, and the Internet, and the Internet, and the Internet, and the Internet, and the Internet, and the Internet, and the Internet, and the Internet, and the Internet, and the Internet, and the Internet, and the Internet, and the Internet, and the Internet, and the Internet, and the Internet, and the Internet, and the Internet, and the Internet, and the Internet, and the Internet, and the Internet, and the Internet, and the Internet, and the Internet, and the Internet, and the Internet, and the Internet, and the, and the Internet, and the Internet, and the Internet, and the Internet,
इंस्टॉलर चलाएं
अंक
slv install मेजबान पर सेवा करने के लिए नियत Grafana इसे घटक सूची से चुनें।bash
$ slv install -i 1.1.1.1,
🚀 Installing software components...
? Select Software Component to Install (Redis)
  Redis
  TiDB (MySQL Cluster)
❯ Grafana
  Prometheus
  Node Exporter
  Kafka Cluster
$ slv install -i 1.1.1.1,
🚀 Installing software components...
? Select Software Component to Install (Redis)
Redis
TiDB (MySQL Cluster)
❯ Grafana
Prometheus
Node Exporter
Kafka Clusterध्यान दें: बदलें1.1.1.1साथ IP अपने सर्वर का पता
विवरण की समीक्षा करें
Ansible लॉन्च करने से पहले सूची और प्लेबुक पथ को मान्य करें। यहां रद्द करें अगर लक्ष्य मेजबान या कॉन्फ़िगरेशन गलत दिखती है।
bash
🚀 Installing software components...
? Select Software Component to Install (Redis) › Grafana
✅ You selected: Grafana

📋 Installation Details:
Software: Grafana
Inventory: 1.1.1.1,
Playbook: /Users/fumi/.slv/template/0.9.800/ansible/cmn/software/install-grafana.yml
? Do you want to proceed with the installation? (y/N) ›
🚀 Installing software components...
? Select Software Component to Install (Redis) › Grafana
✅ You selected: Grafana
📋 Installation Details:
Software: Grafana
Inventory: 1.1.1.1,
Playbook: /Users/fumi/.slv/template/0.9.800/ansible/cmn/software/install-grafana.yml
? Do you want to proceed with the installation? (y/N) ›Ansible Execution
पुष्टिकरण पर,
slv रन Grafana प्लेबुक और एक मूल Linux डेमॉन के रूप में सेवा को कॉन्फ़िगर करता है।bash
🚀 Running ansible: ansible-playbook -i 1.1.1.1, -u solv /Users/fumi/.slv/template/0.9.800/ansible/cmn/software/install-grafana.yml

PLAY [Install and configure Grafana] ****************************************************************

TASK [Gathering Facts] *******************************************************************************
🚀 Running ansible: ansible-playbook -i 1.1.1.1, -u solv /Users/fumi/.slv/template/0.9.800/ansible/cmn/software/install-grafana.yml
PLAY [Install and configure Grafana] ****************************************************************
TASK [Gathering Facts] *******************************************************************************अंतिम बिंदु को सत्यापित करें
सफल स्थापित करने के साथ समाप्त हो गया Grafana लॉग इन URL इसलिए आप तुरंत साइन इन कर सकते हैं।
bash
✅ Installation completed successfully!

🌐 Access Information:

Grafana URL: http://1.1.1.1:3000/login

🔑 Default credentials
Username: admin
Password: admin
✅ Installation completed successfully!
🌐 Access Information:
Grafana URL: http://1.1.1.1:3000/login
🔑 Default credentials
Username: admin
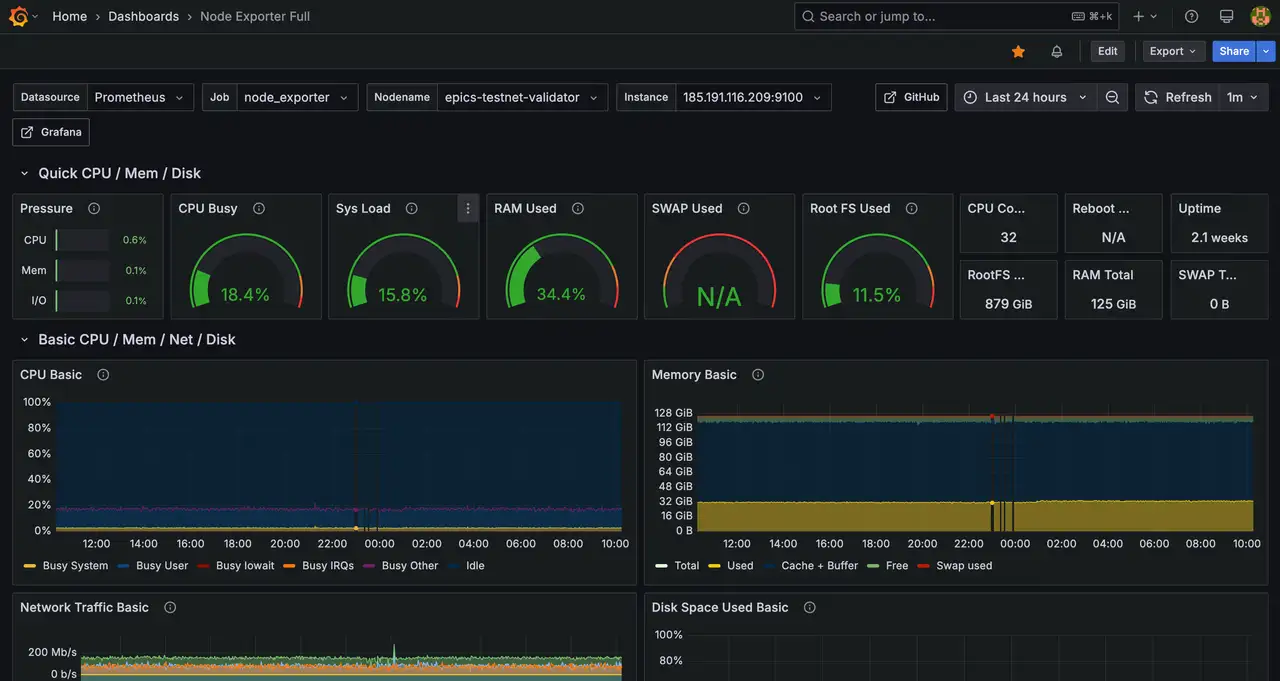
Password: adminडैशबोर्ड
लॉग इन करें
http://1.1.1.1:3000/login अपने डैशबोर्ड को आयात करें या कनेक्ट करें Prometheus एक डेटा स्रोत के रूप में। अपने प्राथमिक डैशबोर्ड के एक स्क्रीनशॉट को कैप्चर करने पर विचार करें, जो एक बार आंतरिक रनबुक के लिए कॉन्फ़िगर किया गया है।