

SLV Install - Node Exporter
SLV Install - Node Exporter
Node Exporter を選ぶ理由
Node Exporter は CPU・メモリ・ディスク・ネットワークなどのハードウェア/OS 指標を Prometheus 向けに公開し、Grafana などの可視化でインフラ問題を早期検知できるようにします。
slv install を使えば、すべてのサーバーに同一のシステムメトリクス収集を手間なく整備できます。ハイライト
- Node Exporter: https://github.com/prometheus/node_exporter
- 軽量バイナリで低オーバーヘッド、ベアメタルや VPS の常駐用途に最適。
- Prometheus/Grafana のダッシュボードやアラートの基盤となるホスト指標を提供。
コマンドの実行
監視対象としたいホストを指定し、Node Exporter を選択してインストールを開始します。
bash
$ slv install -i 1.1.1.1,
🚀 Installing software components...
? Select Software Component to Install (Redis)
  Redis
  TiDB (MySQL Cluster)
  Grafana
  Prometheus
❯ Node Exporter
  Kafka Cluster
$ slv install -i 1.1.1.1,
🚀 Installing software components...
? Select Software Component to Install (Redis)
Redis
TiDB (MySQL Cluster)
Grafana
Prometheus
❯ Node Exporter
Kafka Cluster注意:1.1.1.1の部分は、ご自身のサーバーの IP アドレスに置き換えてください。
実行内容の確認
Ansible 実行前に、インベントリとプレイブックのパスが正しいか確認します。
bash
🚀 Installing software components...
? Select Software Component to Install (Redis) › Node Exporter
✅ You selected: Node Exporter

📋 Installation Details:
Software: Node Exporter
Inventory: 1.1.1.1,
Playbook: /Users/fumi/.slv/template/0.9.800/ansible/cmn/software/install-node-exporter.yml
? Do you want to proceed with the installation? (y/N) ›
🚀 Installing software components...
? Select Software Component to Install (Redis) › Node Exporter
✅ You selected: Node Exporter
📋 Installation Details:
Software: Node Exporter
Inventory: 1.1.1.1,
Playbook: /Users/fumi/.slv/template/0.9.800/ansible/cmn/software/install-node-exporter.yml
? Do you want to proceed with the installation? (y/N) › 実行中のログ
承認後、
slv が Node Exporter のプレイブックを実行し、systemd サービスとして自動起動するよう構成します。bash
🚀 Running ansible: ansible-playbook -i 1.1.1.1, -u solv /Users/fumi/.slv/template/0.9.800/ansible/cmn/software/install-node-exporter.yml

PLAY [Install and configure Node Exporter] ***********************************************************

TASK [Gathering Facts] *******************************************************************************
🚀 Running ansible: ansible-playbook -i 1.1.1.1, -u solv /Users/fumi/.slv/template/0.9.800/ansible/cmn/software/install-node-exporter.yml
PLAY [Install and configure Node Exporter] ***********************************************************
TASK [Gathering Facts] *******************************************************************************エンドポイントの確認
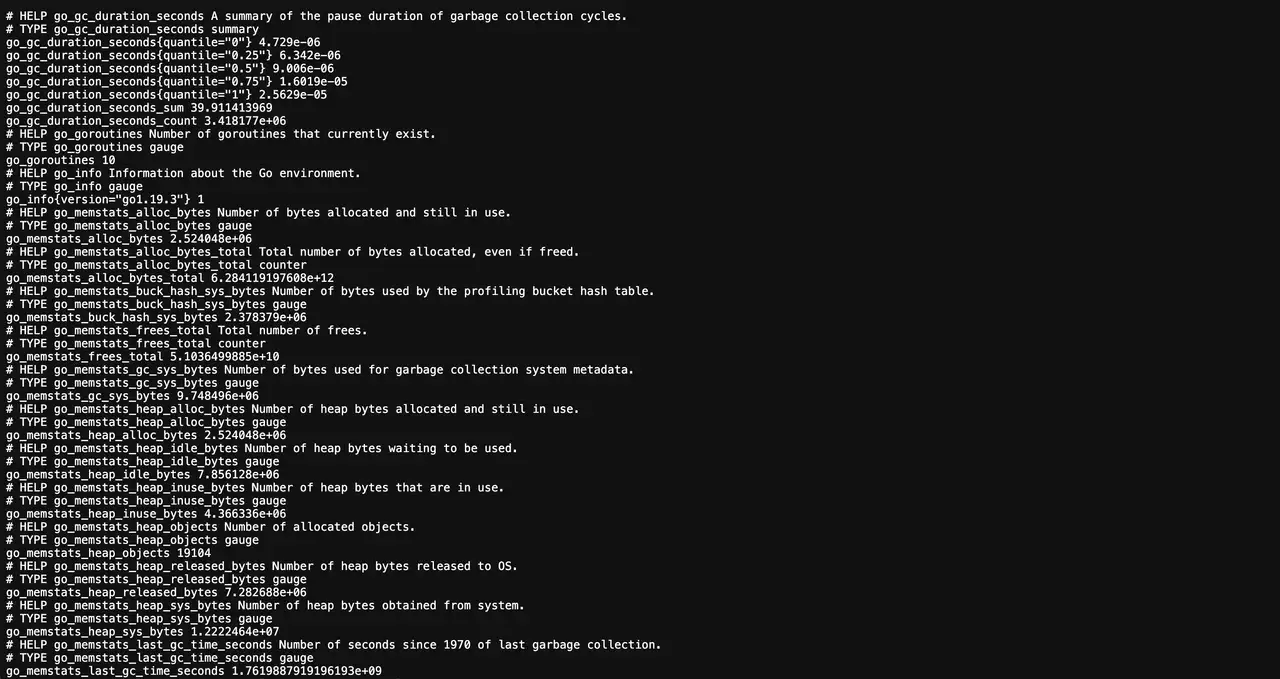
インストール完了後、Node Exporter はポート 9100 でメトリクスを公開します。Prometheus からスクレイプし、Grafana のダッシュボードに活用してください。
bash
✅ Installation completed successfully!

🌐 Access Information:

Node Exporter URL: http://1.1.1.1:9100/metrics
✅ Installation completed successfully!
🌐 Access Information:
Node Exporter URL: http://1.1.1.1:9100/metricsダッシュボード
http://1.1.1.1:9100/metrics で生データを確認し、Prometheus にターゲットを追加したうえで Grafana の既存ダッシュボード(たとえば Node Exporter Full)を取り込むとホスト状態を一望できます。