

SLV Install - Prometheus
SLV Install - Prometheus
Prometheus を選ぶ理由
Prometheus は時系列データの収集と分析に特化した事実上の標準モニタリング基盤で、強力なクエリ言語(PromQL)と豊富なエクスポータを備えています。
slv install を使えば、どの環境でも同一のメトリクス基盤を用意し、Grafana ダッシュボードやアラート設定の土台を簡単に揃えられます。ハイライト
- Prometheus: https://prometheus.io/
- Pull 型スクレイピングで監視トラフィックを制御しつつ、PromQL で即座に有用なインサイトを得られます。
- Grafana や Alertmanager とネイティブ連携し、可視化と通知をスムーズに統合可能。
コマンドの実行
Prometheus を稼働させたいホストを指定し、コンポーネント一覧から Prometheus を選びます。
bash
$ slv install -i 1.1.1.1,
🚀 Installing software components...
? Select Software Component to Install (Redis)
  Redis
  TiDB (MySQL Cluster)
  Grafana
❯ Prometheus
  Node Exporter
  Kafka Cluster
$ slv install -i 1.1.1.1,
🚀 Installing software components...
? Select Software Component to Install (Redis)
Redis
TiDB (MySQL Cluster)
Grafana
❯ Prometheus
Node Exporter
Kafka Cluster注意:1.1.1.1の部分は、ご自身のサーバーの IP アドレスに置き換えてください。
実行内容の確認
Ansible を実行する前に、インベントリやプレイブックのパス、必要があれば limit を確認します。
bash
🚀 Installing software components...
? Select Software Component to Install (Redis) › Prometheus
✅ You selected: Prometheus

📋 Installation Details:
Software: Prometheus
Inventory: 1.1.1.1,
Playbook: /Users/fumi/.slv/template/0.9.800/ansible/cmn/software/install-prometheus.yml
? Do you want to proceed with the installation? (y/N) ›
🚀 Installing software components...
? Select Software Component to Install (Redis) › Prometheus
✅ You selected: Prometheus
📋 Installation Details:
Software: Prometheus
Inventory: 1.1.1.1,
Playbook: /Users/fumi/.slv/template/0.9.800/ansible/cmn/software/install-prometheus.yml
? Do you want to proceed with the installation? (y/N) › 実行中のログ
承認後、Ansible が Prometheus を systemd サービスとしてセットアップし、初期設定を配置します。
bash
🚀 Running ansible: ansible-playbook -i 1.1.1.1, -u solv /Users/fumi/.slv/template/0.9.800/ansible/cmn/software/install-prometheus.yml

PLAY [Install and configure Prometheus] **************************************************************

TASK [Gathering Facts] *******************************************************************************
🚀 Running ansible: ansible-playbook -i 1.1.1.1, -u solv /Users/fumi/.slv/template/0.9.800/ansible/cmn/software/install-prometheus.yml
PLAY [Install and configure Prometheus] **************************************************************
TASK [Gathering Facts] *******************************************************************************エンドポイントの確認
完了すると Prometheus の Web UI へアクセスするための URL が表示されます。ターゲットが適切にスクレイプされているか確認しましょう。
bash
✅ Installation completed successfully!

🌐 Access Information:

Prometheus URL: http://1.1.1.1:3090
✅ Installation completed successfully!
🌐 Access Information:
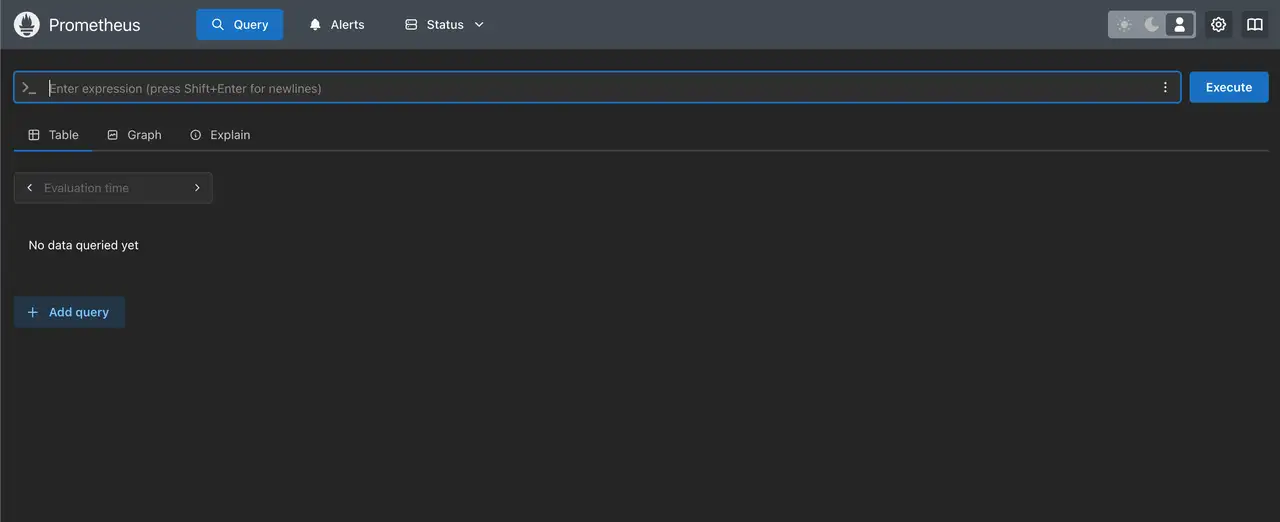
Prometheus URL: http://1.1.1.1:3090ダッシュボード
http://1.1.1.1:3090 を開いてターゲット一覧をチェックし、Grafana と組み合わせて PromQL によるグラフ化や Alertmanager 経由の通知設定を行いましょう。