

SLV 설치 - Prometheus
SLV 설치 - Prometheus
왜? Prometheus?
Prometheus Time-series 모니터링을 위한 de facto 표준이며 강력한 쿼리 언어 (PromQL) 및 수출의 풍부한 생태계를 가진 메트릭을 수집합니다. 그것을 통해 설치
slv install 당신에게 피드를 일관적인 메트릭 백본을 제공합니다. Grafana 모든 환경의 대시보드 및 경고 규칙.높은 조명
- Prometheus: https://prometheus.io/
- Pull-based scraping은 PromQL 표면의 동작성 통찰력을 통해 관찰 가능한 트래픽을 예측할 수 있도록 합니다.
- Native 통합 Grafana Alertmanager를 사용하면 추가 설정 없이 시각화 및 알림을 할 수 있습니다.
설치 프로그램을 실행
실행해야 하는 호스트를 타겟팅 Prometheus 그리고 구성요소 선택기에서 그것을 선택합니다.
bash
$ slv install -i 1.1.1.1,
🚀 Installing software components...
? Select Software Component to Install (Redis)
  Redis
  TiDB (MySQL Cluster)
  Grafana
❯ Prometheus
  Node Exporter
  Kafka Cluster
$ slv install -i 1.1.1.1,
🚀 Installing software components...
? Select Software Component to Install (Redis)
Redis
TiDB (MySQL Cluster)
Grafana
❯ Prometheus
Node Exporter
Kafka Cluster참고: 대체1.1.1.1으로 IP 서버의 주소.
자주 묻는 질문
playbook의 앞에 재고, playbook 경로 및 선택적인 한계를 확인하십시오.
bash
🚀 Installing software components...
? Select Software Component to Install (Redis) › Prometheus
✅ You selected: Prometheus

📋 Installation Details:
Software: Prometheus
Inventory: 1.1.1.1,
Playbook: /Users/fumi/.slv/template/0.9.800/ansible/cmn/software/install-prometheus.yml
? Do you want to proceed with the installation? (y/N) ›
🚀 Installing software components...
? Select Software Component to Install (Redis) › Prometheus
✅ You selected: Prometheus
📋 Installation Details:
Software: Prometheus
Inventory: 1.1.1.1,
Playbook: /Users/fumi/.slv/template/0.9.800/ansible/cmn/software/install-prometheus.yml
? Do you want to proceed with the installation? (y/N) ›Ansible 실행을 관찰
slv 설치 가능 Prometheus 시스템 서비스로 기본 설정에 드롭합니다.bash
🚀 Running ansible: ansible-playbook -i 1.1.1.1, -u solv /Users/fumi/.slv/template/0.9.800/ansible/cmn/software/install-prometheus.yml

PLAY [Install and configure Prometheus] **************************************************************

TASK [Gathering Facts] *******************************************************************************
🚀 Running ansible: ansible-playbook -i 1.1.1.1, -u solv /Users/fumi/.slv/template/0.9.800/ansible/cmn/software/install-prometheus.yml
PLAY [Install and configure Prometheus] **************************************************************
TASK [Gathering Facts] *******************************************************************************Endpoint를 검증
완료되면 CLI가 인쇄됩니다. Prometheus 웹 UI URL 그래서 당신은 대상을 올바르게 긁는 것을 확인할 수 있습니다.
bash
✅ Installation completed successfully!

🌐 Access Information:

Prometheus URL: http://1.1.1.1:3090
✅ Installation completed successfully!
🌐 Access Information:
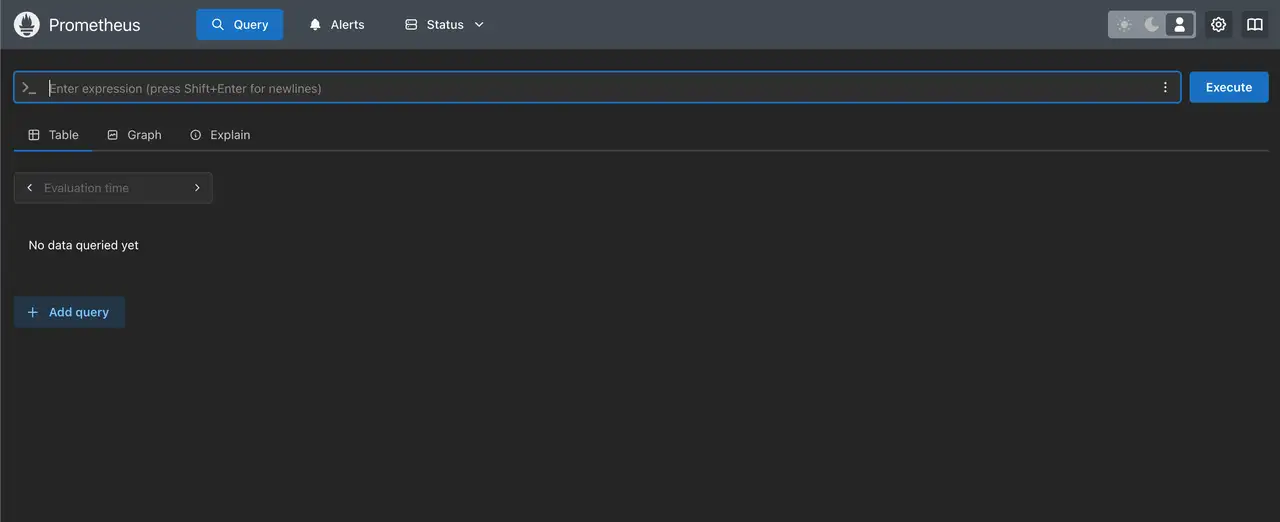
Prometheus URL: http://1.1.1.1:3090대시보드
의 의 의 의 의 의 의 의 의 의 의 의 의 의 의 의 의 의 의 의 의 의 의 의 의 의 의 의 의 의 의 의 의 의 의 의 의 의 의 의 의 의 의 의 의 의 의 의 의 의 의 의 의 의 의 의 의 의 의 의 의 의 의 의 의 의 의 의 의 의 의 의 의 의 의 의 의 의 의 의 의 의 의 의 의 의 의 의 의 의 의 의 의 의 의 의 의 의 의 의 의 의 의 의 의 의 의 의 의 의 의 의 의 의 의 의 의 의 의 의 의 의 의 의 의 의 의 의
http://1.1.1.1:3090 인증 및 인증 Prometheus 대상 페이지. 쌍으로 Grafana PromQL을 사용하여 그래프 메트릭으로 Alertmanager를 통해 경고 규칙을 설정합니다.