

SLV 설치 - Grafana
SLV 설치 - Grafana
왜? Grafana?
Grafana metrics, logs, traces를 풍부한 대시보드로 중앙 집중화하여 작업자가 한 눈에 인프라 건강을 이해할 수 있습니다.
slv install 모든 환경을 수동 규정없이 동일한 관찰 가능한 스택을 제공합니다.높은 조명
- Grafana: https://grafana.com/
- reusable 대쉬보드를 구축하고 표면 검증자 또는 경고 RPC 성능 문제 즉시.
- 연결하기 Prometheus, Loki, MySQL, 그리고 상자에서 다른 자료 소스의 수십.
설치 프로그램을 실행
팟캐스트
slv install 호스트에서 봉사하는 데 운명 Grafana 구성 요소 목록에서 선택.bash
$ slv install -i 1.1.1.1,
🚀 Installing software components...
? Select Software Component to Install (Redis)
  Redis
  TiDB (MySQL Cluster)
❯ Grafana
  Prometheus
  Node Exporter
  Kafka Cluster
$ slv install -i 1.1.1.1,
🚀 Installing software components...
? Select Software Component to Install (Redis)
Redis
TiDB (MySQL Cluster)
❯ Grafana
Prometheus
Node Exporter
Kafka Cluster참고: 대체1.1.1.1으로 IP 서버의 주소.
자주 묻는 질문
Ansible을 실행하기 전에 재고 및 재생 목록 경로가 유효하다. 대상 호스트 또는 구성이 잘못 보이는 경우 여기를 취소하십시오.
bash
🚀 Installing software components...
? Select Software Component to Install (Redis) › Grafana
✅ You selected: Grafana

📋 Installation Details:
Software: Grafana
Inventory: 1.1.1.1,
Playbook: /Users/fumi/.slv/template/0.9.800/ansible/cmn/software/install-grafana.yml
? Do you want to proceed with the installation? (y/N) ›
🚀 Installing software components...
? Select Software Component to Install (Redis) › Grafana
✅ You selected: Grafana
📋 Installation Details:
Software: Grafana
Inventory: 1.1.1.1,
Playbook: /Users/fumi/.slv/template/0.9.800/ansible/cmn/software/install-grafana.yml
? Do you want to proceed with the installation? (y/N) ›Ansible 실행을 관찰
확인 후
slv 을 실행 Grafana playbook을 만들고 기본 Linux daemon로 서비스를 구성합니다.bash
🚀 Running ansible: ansible-playbook -i 1.1.1.1, -u solv /Users/fumi/.slv/template/0.9.800/ansible/cmn/software/install-grafana.yml

PLAY [Install and configure Grafana] ****************************************************************

TASK [Gathering Facts] *******************************************************************************
🚀 Running ansible: ansible-playbook -i 1.1.1.1, -u solv /Users/fumi/.slv/template/0.9.800/ansible/cmn/software/install-grafana.yml
PLAY [Install and configure Grafana] ****************************************************************
TASK [Gathering Facts] *******************************************************************************Endpoint를 검증
성공적인 설치 끝과 Grafana 의논하기 URL 그리고 기본 자격 증명 그래서 당신은 즉시 로그인 할 수 있습니다.
bash
✅ Installation completed successfully!

🌐 Access Information:

Grafana URL: http://1.1.1.1:3000/login

🔑 Default credentials
Username: admin
Password: admin
✅ Installation completed successfully!
🌐 Access Information:
Grafana URL: http://1.1.1.1:3000/login
🔑 Default credentials
Username: admin
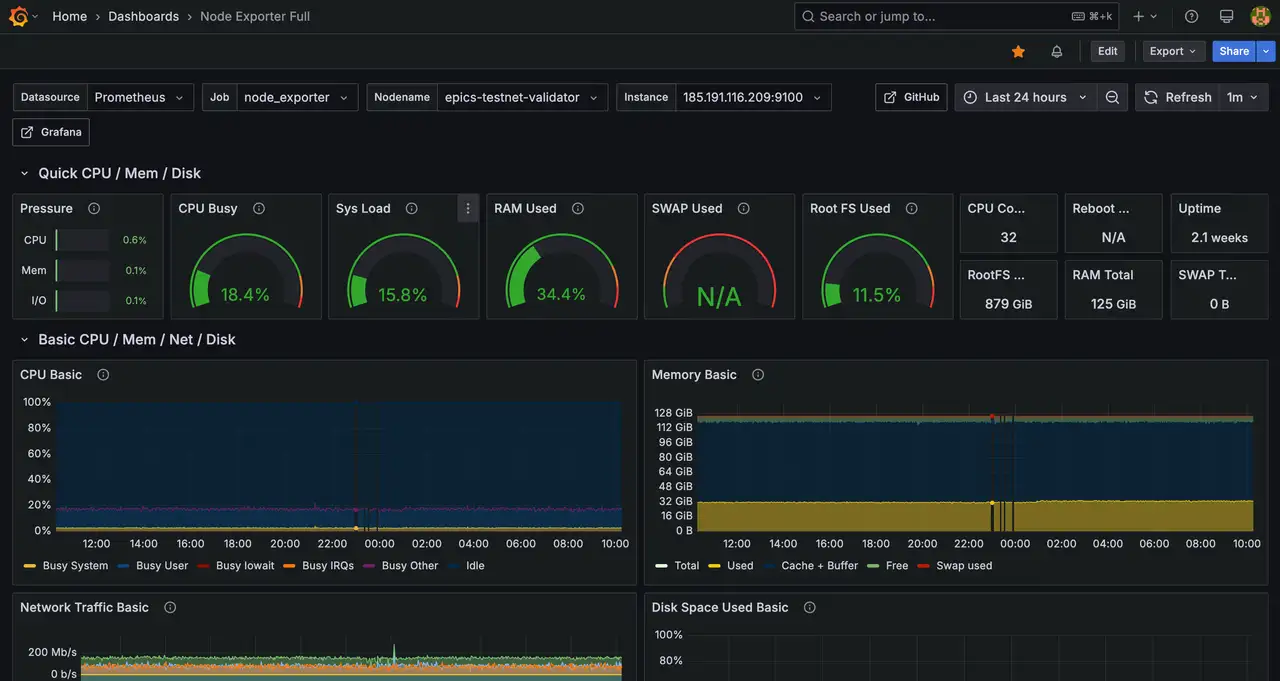
Password: admin대시보드
의 의 의 의 의 의 의 의 의 의 의 의 의 의 의 의 의 의 의 의 의 의 의 의 의 의 의 의 의 의 의 의 의 의 의 의 의 의 의 의 의 의 의 의 의 의 의 의 의 의 의 의 의 의 의 의 의 의 의 의 의 의 의 의 의 의 의 의 의 의 의 의 의 의 의 의 의 의 의 의 의 의 의 의 의 의 의 의 의 의 의 의 의 의 의 의 의 의 의 의 의 의 의 의 의 의 의 의 의 의 의 의 의 의 의 의 의 의 의 의 의 의 의 의 의 의 의 의
http://1.1.1.1:3000/login 대시보드를 가져오거나 연결 Prometheus 데이터 소스로. 내부 runbooks에 한 번 설정 한 초록의 스크린 샷을 캡처 고려.