

SLV Install - Node Exporter
SLV Install - Node Exporter
¿Por qué Node Exporter?
Node Exporter expone hardware detallado y métricas del sistema operativo: CPU, memoria, Discord, red, así que Prometheus y Grafana pueden alertar sobre problemas de infraestructura antes de que impacten las cargas de trabajo de Solana. Instalarla vía
slv install asegura que cada servidor reporte un conjunto consistente de métricas del sistema sin la configuración manual.Aspectos destacados
- Node Exporter: https://github.com/prometheus/node_exporter
- Ligero binario con sobrecarga mínima, perfecto para el bare metal o los hosts VPS.
- Proporciona los paneles de referencia y las alertas se basan en Prometheus/Grafana.
Corre el Installer
Punto
slv install en el host que desea monitorear y seleccionar Node Exporter de la lista.bash
$ slv install -i 1.1.1.1,
🚀 Installing software components...
? Select Software Component to Install (Redis)
  Redis
  TiDB (MySQL Cluster)
  Grafana
  Prometheus
❯ Node Exporter
  Kafka Cluster
$ slv install -i 1.1.1.1,
🚀 Installing software components...
? Select Software Component to Install (Redis)
Redis
TiDB (MySQL Cluster)
Grafana
Prometheus
❯ Node Exporter
Kafka ClusterNota: Reemplazar1.1.1.1con la dirección IP de su propio servidor.
Revisar los detalles
Utilice la pantalla de detalles para confirmar el inventario correcto y el libro de juegos antes de que Ansible comience.
bash
🚀 Installing software components...
? Select Software Component to Install (Redis) › Node Exporter
✅ You selected: Node Exporter

📋 Installation Details:
Software: Node Exporter
Inventory: 1.1.1.1,
Playbook: /Users/fumi/.slv/template/0.9.800/ansible/cmn/software/install-node-exporter.yml
? Do you want to proceed with the installation? (y/N) ›
🚀 Installing software components...
? Select Software Component to Install (Redis) › Node Exporter
✅ You selected: Node Exporter
📋 Installation Details:
Software: Node Exporter
Inventory: 1.1.1.1,
Playbook: /Users/fumi/.slv/template/0.9.800/ansible/cmn/software/install-node-exporter.yml
? Do you want to proceed with the installation? (y/N) › Observar la ejecución ansible
slv ejecuta el Node Exporter playbook y lo permite como un servicio sistematizado por lo que comienza automáticamente en el arranque.bash
🚀 Running ansible: ansible-playbook -i 1.1.1.1, -u solv /Users/fumi/.slv/template/0.9.800/ansible/cmn/software/install-node-exporter.yml

PLAY [Install and configure Node Exporter] ***********************************************************

TASK [Gathering Facts] *******************************************************************************
🚀 Running ansible: ansible-playbook -i 1.1.1.1, -u solv /Users/fumi/.slv/template/0.9.800/ansible/cmn/software/install-node-exporter.yml
PLAY [Install and configure Node Exporter] ***********************************************************
TASK [Gathering Facts] *******************************************************************************Verificar el endpoint
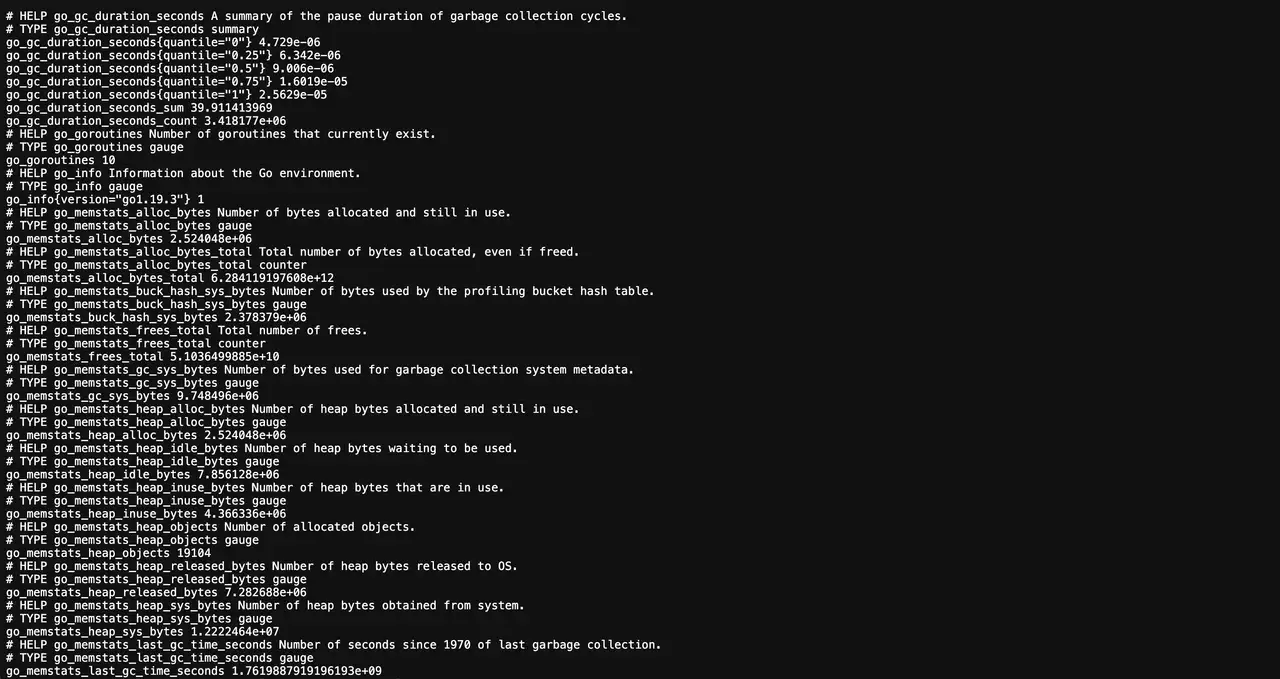
Después de la instalación, Node Exporter publica métricas en el puerto 9100. Prometheus debe raspar este endpoint para alimentar dashboards y alertas.
bash
✅ Installation completed successfully!

🌐 Access Information:

Node Exporter URL: http://1.1.1.1:9100/metrics
✅ Installation completed successfully!
🌐 Access Information:
Node Exporter URL: http://1.1.1.1:9100/metricsDashboard
Visita
http://1.1.1.1:9100/metrics para confirmar la salida cruda, a continuación, añadir el objetivo en Prometheus y enchufar los dashboards predefinidos de Grafana (por ejemplo, Node Exporter Full) para visualizar la salud del huésped.